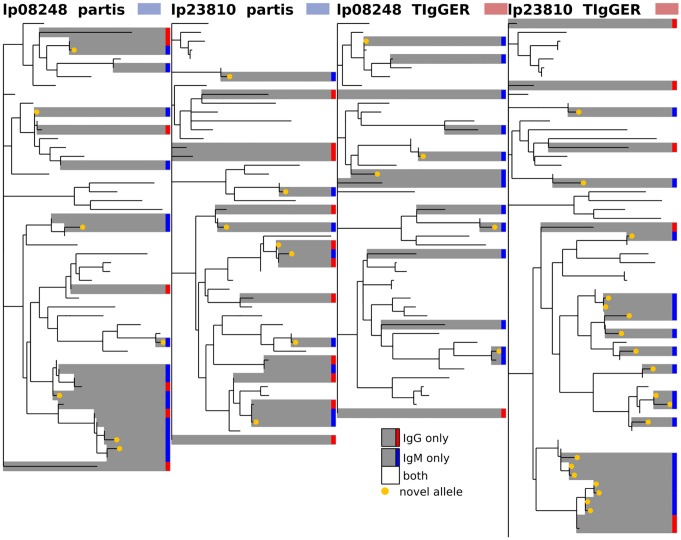
Fig 12. Comparison of inferred germline sets for IgM vs IgG data from subjects lp08248 and lp23810 from [36] for partis (left) and TIgGER (right).
The phylogenetic tree is constructed with a leaf for each germline gene that was inferred for either of the two isotypes. Branch lengths connecting different V gene families are set to zero. Leaves are colored according to the number of isotype-specific samples for which the corresponding gene was inferred: either one (grey) or both (white). See Fig 10 for other results for these subjects. The same trees, but with leaves labeled with gene names, are shown in S8 Fig.

