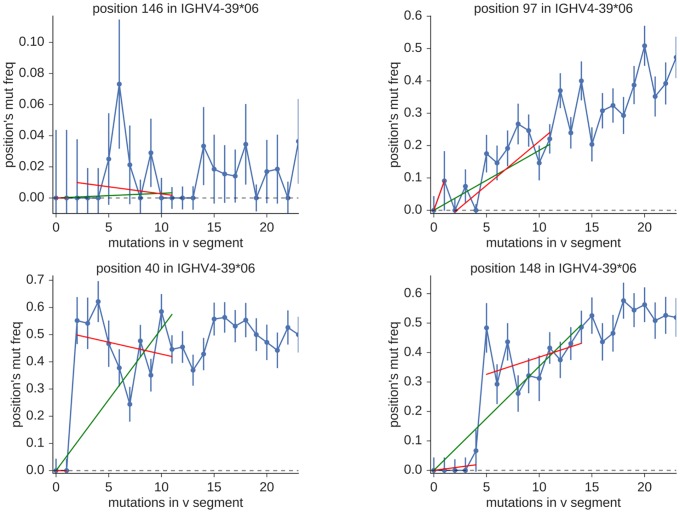
Fig 14. Example one-piece (green) and two-piece (red) fits for positions without (top row) and with (bottom row) evidence for new alleles.
The left and right plots in the top row show the difference between positions with low and high mutability (cold and hot spots). The bottom row shows a position with evidence for a new allele with Nsnp equal to two (left) and a similar plot for Nsnp equals five (right). Note that both one-piece and two-piece models fit well in the top row, whereas in the bottom row only the two-piece model provides an adequate fit.

