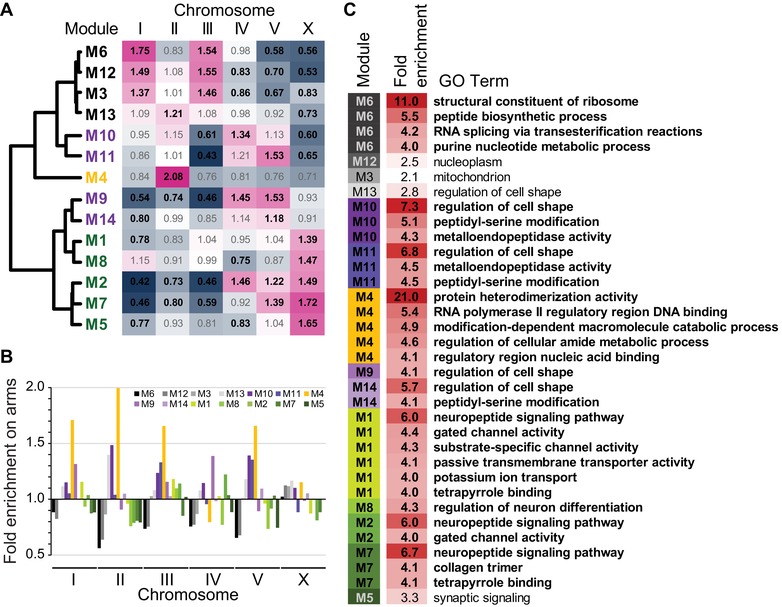
Figure 2.

(A) Enrichment of gene membership among chromosomes for each coexpression module. Bold black text for observed/expected values in the heatmap indicates significant over‐ or under‐enrichment (Holm–Bonferroni corrected P‐values < 0.05). (B) Enrichment of module gene membership on chromosome arms (values <1 imply enrichment in chromosome centers), where arm regions have higher recombination, higher density of repetitive elements, and lower gene density. Genome‐wide significant enrichment on autosomal arms for M4, M10, and M13 and in centers for M5 and M12 (all Holm–Bonferroni corrected P‐values < 0.003). (C) List of the 30 most enriched (>fourfold) gene ontology (GO) terms for each module, plus the single most enriched GO term observed for M3, M5, M12, and M13 (all Q‐values < 0.005; 346 significantly enriched GO terms total across the 14 modules; Tables S1 and S2). Module identities colored and sorted by expression profile similarity as in Figure 1.
