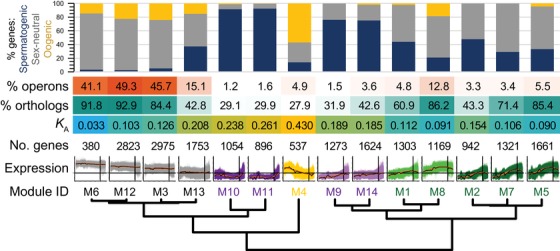
Figure 3.

Functional and evolutionary properties of genes within each coexpression module. The proportion of genes with enrichment of spermatogenic, oogenic, or sex‐neutral expression categories defined by Ortiz et al. (2014), shown in the cumulative bar graph. Heatmap shows the incidence of module genes in operons, the fraction of module members having orthologs in C. briggsae, and the median rate of nonsynonymous site substitution (K A) as a measure of protein sequence divergence. Module order sorted by expression profile similarity as in Figure 1.
