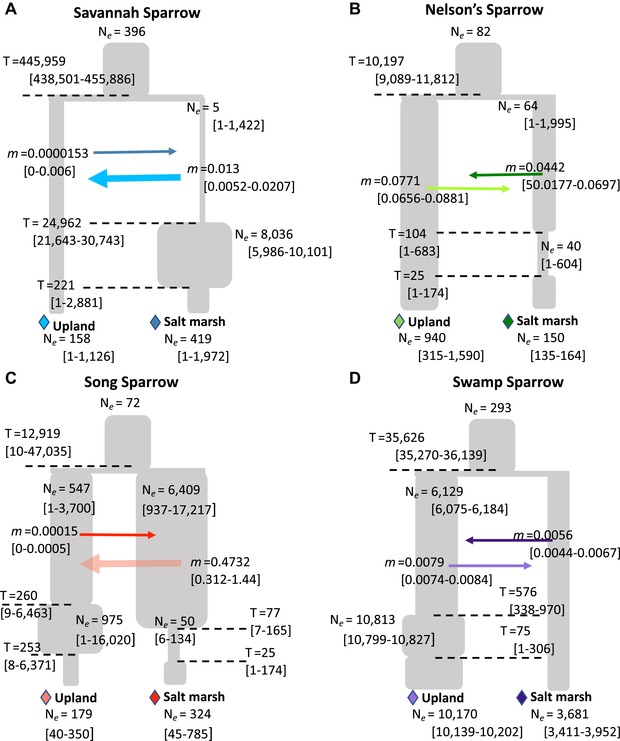
Figure 3.

Demographic history of salt marsh and upland populations of four sparrow species pairs. Each panel presents estimates from dadi for each of the four species. Estimates include effective population sizes (N e) and divergence times (dotted lines; T). Gene flow (m) is shown as arrows between lineages (migration is continuous and bidirectional). Migration rates refer to the proportion of immigrants within the population the arrow points to. All parameter estimates are expressed as means with the 95% confidence intervals in brackets. Interpretation should be focused on relative comparisons between parameter estimates, rather than actual value of the estimates.
