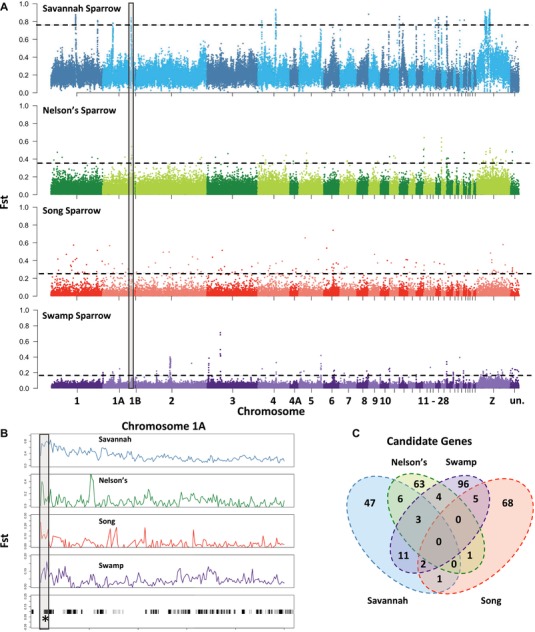
Figure 4.

Genome‐wide divergence between upland‐salt marsh pairs of sparrows. (A) Manhattan plots depict the genomic landscape (F ST) in nonoverlapping 25 kb windows for each comparison. Dashed line represents 5 standard deviations above the genome‐wide mean. (B) Example of parallel evolution where a peak is shared in three of the four comparisons (savannah, Nelson's, and swamp). Shared peak is boxed in gray in panels (A) and (B). Bottom graph shows the genes housed in this region (genes are denoted by gray and black boxes); * denotes the candidate gene—SLC41A2—under selection. (C) Venn diagram depicting the number of unique and shared candidate genes across the four species comparisons.
