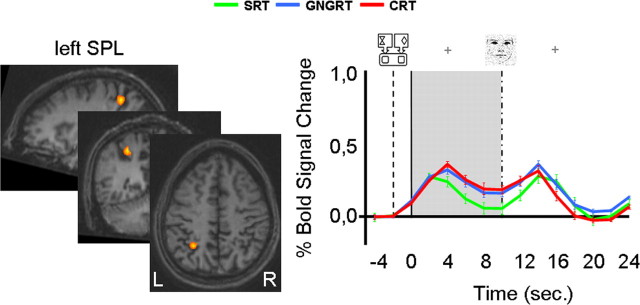
Figure 3.
Group activation map and %BSC for the conjunction analysis involving the delay period: [(CRT vs SRT) and (GNGRT vs SRT)]. Only one area in the left SPL (BA7; Talairach coordinates, x = −29, y = −50, z = 43; volume, 534 mm3) was more active for GNGRT and CRT compared with SRT. Two-tailed post hoc t tests showed that the %BSC for GNGRT did not differ from that for CRT (t(9) = −0.927; p = 0.378), and the %BSC for both was significantly higher than SRT (GNGRT vs SRT, t(9) = 3.98, p = 0.003; CRT vs SRT, t(9) = 5.45; p = 0.0001). The %BSC for the delay period was calculated by averaging data points in a time window between 2 and 10 s. Data are based on Talairach-averaged group results, shown for clarity on a single subject’s anatomical area (which is not representative of sulcal patterns for all subjects). The gray area highlights the length of the delay period. The dotted line represents instructions onset; the solid line represents delay period onset; the dotted and pointed line represents stimulus onset; sec. represents seconds. Error bars indicate SE.

