Figure 3.

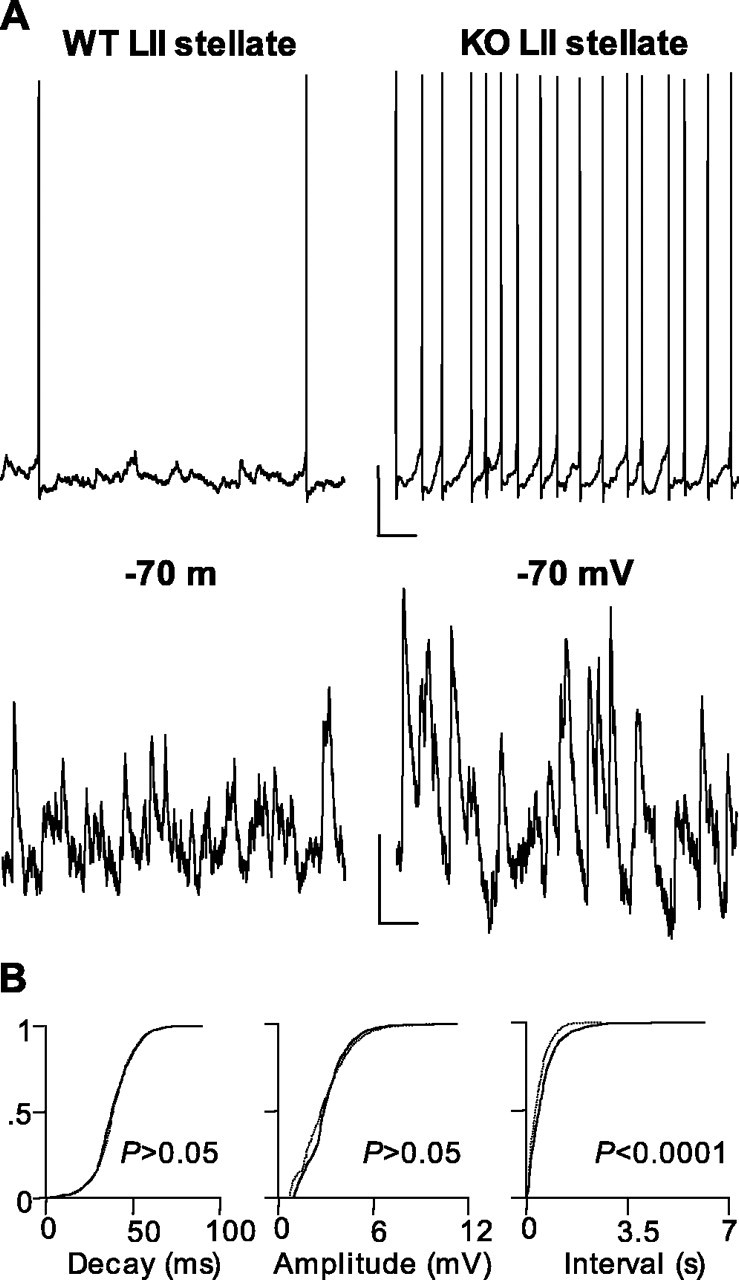
Elevated excitatory activity in superficial mEC layers in slices from LPA1−/− mice. A, Example traces showing altered spike generation and EPSP inputs to stellate cells during population gamma oscillations in control (WT, left panel) and LPA1−/− (KO, right panel) slices. Spike trains were taken at resting membrane potential (−58 mV) in each case. Cells were held at −70 mV for EPSP recordings. Note the large increase in both excitatory input and spike output in these cells. Calibration: 10 mV, 200 ms (action potentials, top panels); 2 mV, 50 ms (EPSPs, bottom panels). B, Cumulative probability plots for EPSP data showing no significant change in decay time or peak amplitude but a large increase in the rate of EPSP invasion of stellate cells from LPA1−/− mice (KO) compared with controls (WT).
