
Figure 4.
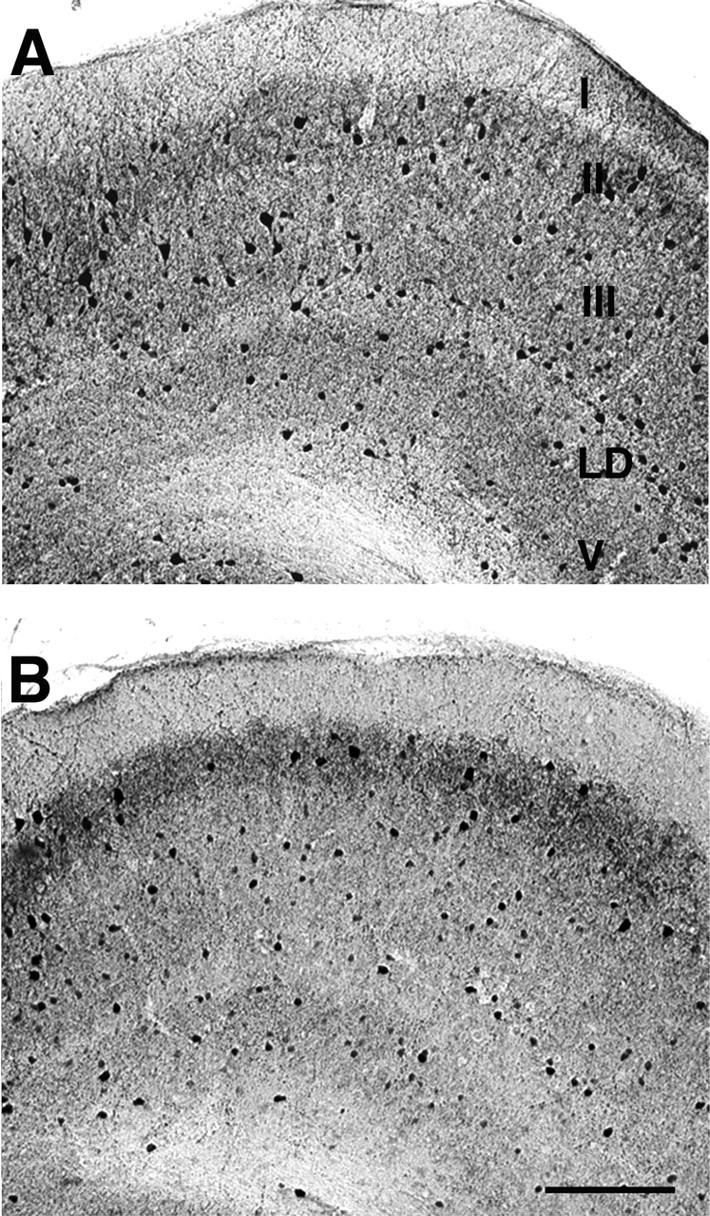
LPA1−/− mice show reduced parvalbumin-immunoreactive interneuron numbers in mEC. Shown is the distribution of parvalbumin-immunoreactive neurons in the entorhinal cortex of WT (A) and KO (B) mice. Parvalbumin-immunoreactive cells were counted in microscopic view fields, as shown in example panels. KO entorhinal cortex (B) showed a decrease in the number of parvalbumin-immunoreactive neurons in layer II compared with WT (A) (see Results). I–III, V, Layers I–III and V; LD, lamina dissecans. Scale bar: (in B) A, B, 65 μm.