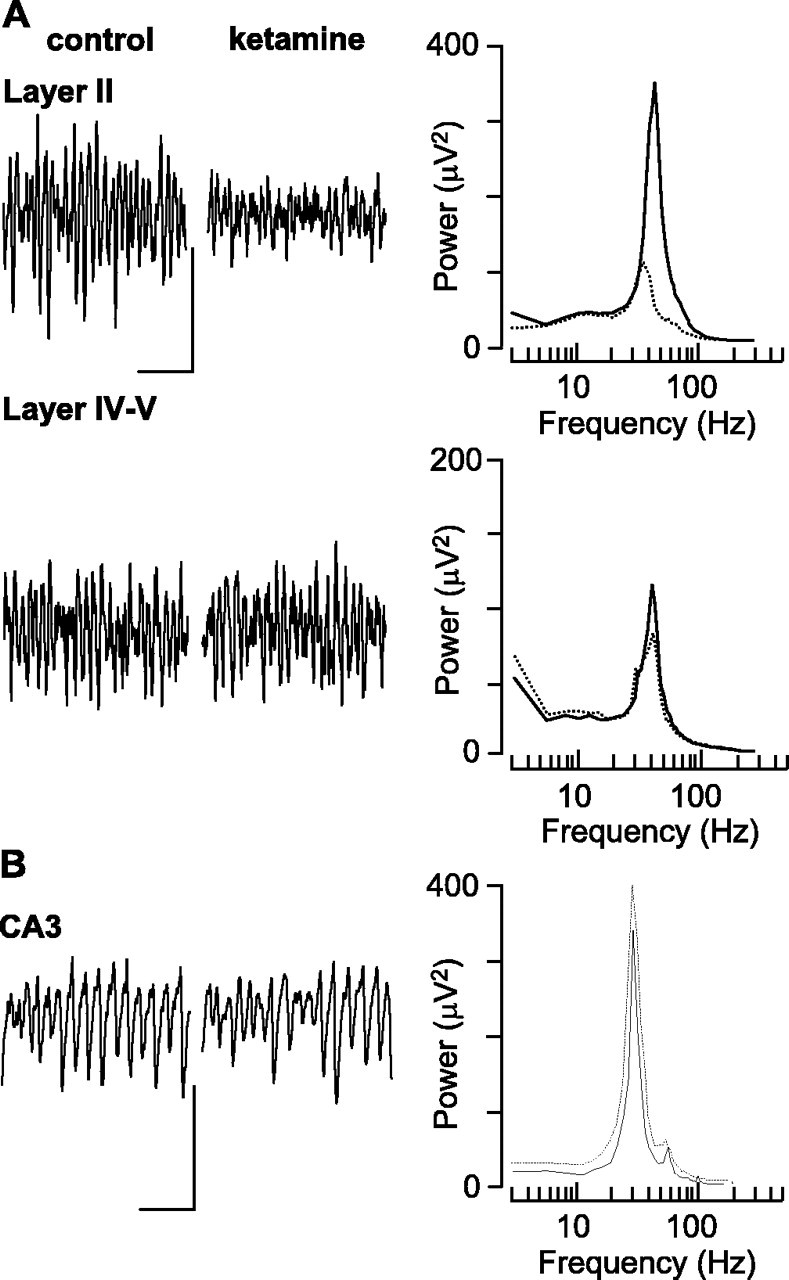
Figure 7.

Ketamine application to control slices mimics the anatomical profile of disrupted gamma rhythms seen in LPA1−/− slices. A, Example traces show 0.5 s of field potential activity in superficial (layer II) and deep (layer IV/V) laminas in the presence and absence of ketamine (20 μm). Calibration: 50 μV, 100 ms. Pooled power spectra (n = 7) illustrate the selective reduction in gamma frequency oscillations in superficial entorhinal cortex. B, Example traces show 0.5 s of field potential activity in hippocampal area CA3 in the presence and absence of ketamine (20 μm). Calibration: 50 μV, 100 ms. Pooled power spectra (n = 7) show lack of effect of ketamine on hippocampal gamma rhythms. Control data are plotted as solid lines; data gathered in the presence of ketamine are plotted as dashed lines.
