Figure 3.
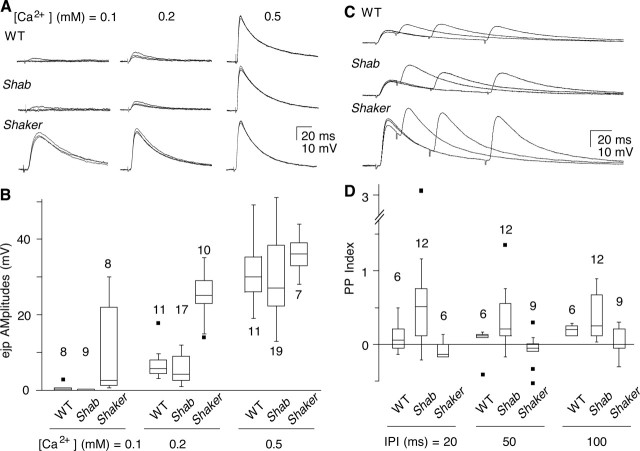
Basal transmitter release and pair-pulse facilitation. A, B, Basal transmitter release was examined by monitoring ejp responses to individual nerve stimuli (≤0.5 Hz). A, Superimposed sample traces. B, Box plot of ejp amplitudes. Note that ejps in Sh were significantly larger than WT at 0.1 and 0.2 mm external Ca2+, whereas those in Shab did not differ from WT. C, D, Pair-pulse facilitation of ejps. Ejp responses to pair-pulse stimulation were examined at different interpulse intervals (IPIs) (20, 50, and 100 ms). Shab displayed significantly greater facilitation than WT at shorter IPIs, whereas Sh showed depression. [Ca2+] = 0.2 mm. The number of muscles examined is indicated. Dots indicate outliers.

