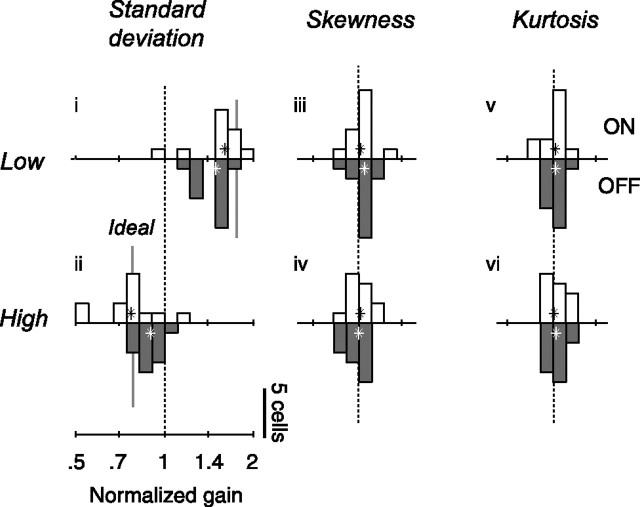
Figure 6.
Changes in neuronal gain for the population of neurons (n = 25), the same as in Figure 5 except that open and closed histograms show for ON and OFF cells the ratios of observed amplitude changes over those predicted by the linear nonlinear Poisson model.

