
Figure 7.
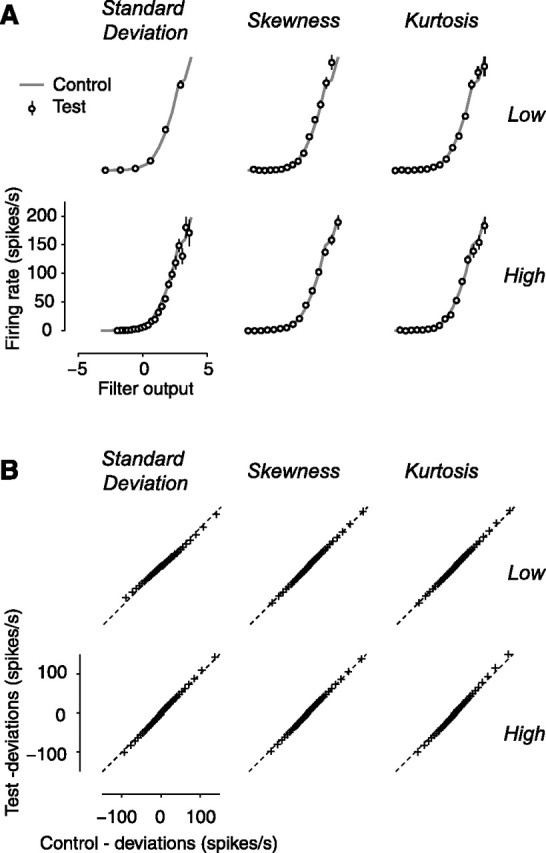
Model performance. A, The nonlinearity is approximately constant across stimulus conditions. Results for the example neuron of Figures 2, 3, and 4. Data points indicate the nonlinearities measured in the test conditions. The gray curve indicates the nonlinearity measured in the control condition (Fig. 3B). B, The quality of model predictions is similar across conditions. Results for the population of neurons (n = 25) are shown. Data points indicate quantiles of deviations in test conditions as a function of quantiles observed in the control condition. The dashed lines indicate unity relationship.