
Figure 9.
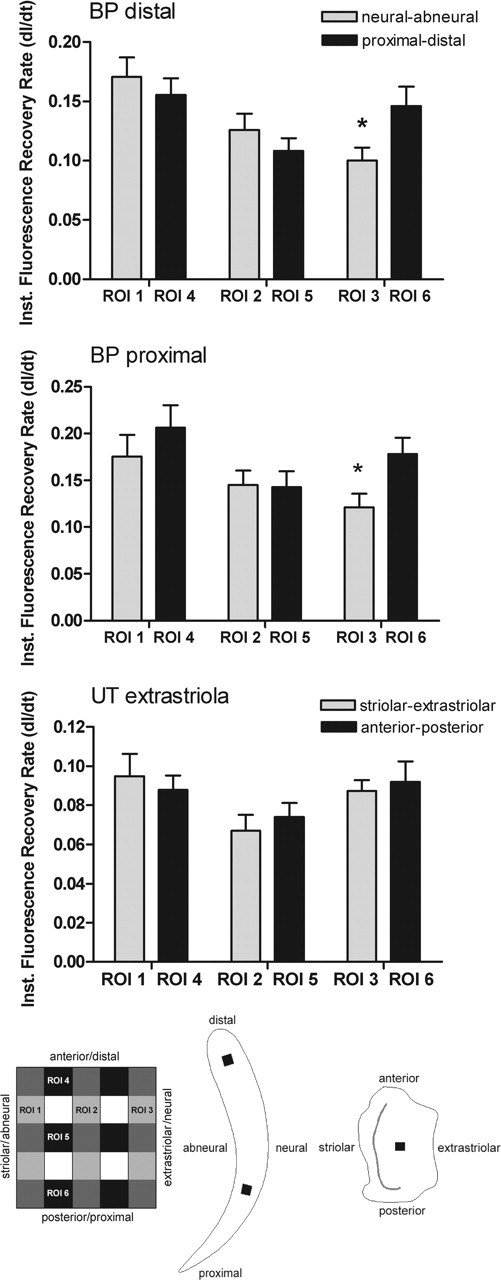
Quantification of the spatial patterns of fluorescence recovery. The mean derivatives (±SD) of the instantaneous fluorescence recovery rates within an optical section are plotted for six ROIs covering the bleached area in the distal basilar papilla (n = 11), the proximal basilar papilla (BP; n = 11), and the extrastriolar utricular macula (UT; n = 9). The asterisk indicates significant differences in the fluorescence recovery rates between the abneural (ROI 1) and neural (ROI 3) regions within the basilar papilla (paired Student’s t test; p < 0.05). The schematic illustrations indicate the orientation of the ROIs within the bleached square, and the locations of the bleached areas (black squares) within the basilar papilla and utricular macula. The gray strip in the utricle marks the striola.