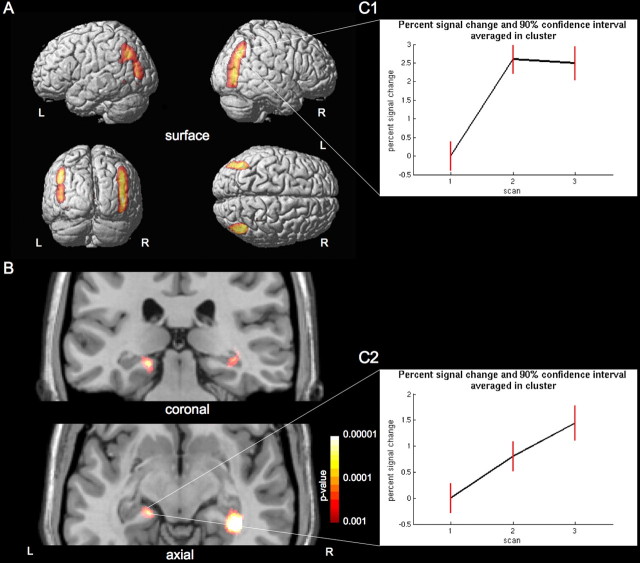
Figure 1.
Gray matter increase related to learning. Statistical parametric maps demonstrating the structural difference in gray matter during the learning period in medical students. The left side of the picture is the left side of the brain (L, left; R, right). A, Significant gray matter increase between the first two time points (p < 0.05, corrected for multiple comparisons using FWE) in posterior parietal cortex is superimposed on the cortical surface of a representative single subject. B, Significant gray matter increase between the first, second, and third time points in the hippocampus. The image is superimposed (p < 0.001 uncorrected) onto two selected slices of a representative single subject. The right hippocampus is significant at p < 0.05 (FWE corrected), and the left hippocampus is significant after application of a small volume correction using the hippocampal region as defined in the WFU PickAtlas (p < 0.05, FWE corrected). C, Plots of percentage of signal change (black line) and 90% confidence interval (red line) averaged over the cluster of the right posterior parietal cortex (C1) and left hippocampus (C2) over the three time points. The gray matter increase in the parietal cortex had not changed significantly between the second and third scans during the semester break 3 months later. The posterior hippocampus showed an initial increase in gray matter during the learning period, which was even more pronounced in the third scan after the learning period.

