
Figure 2.
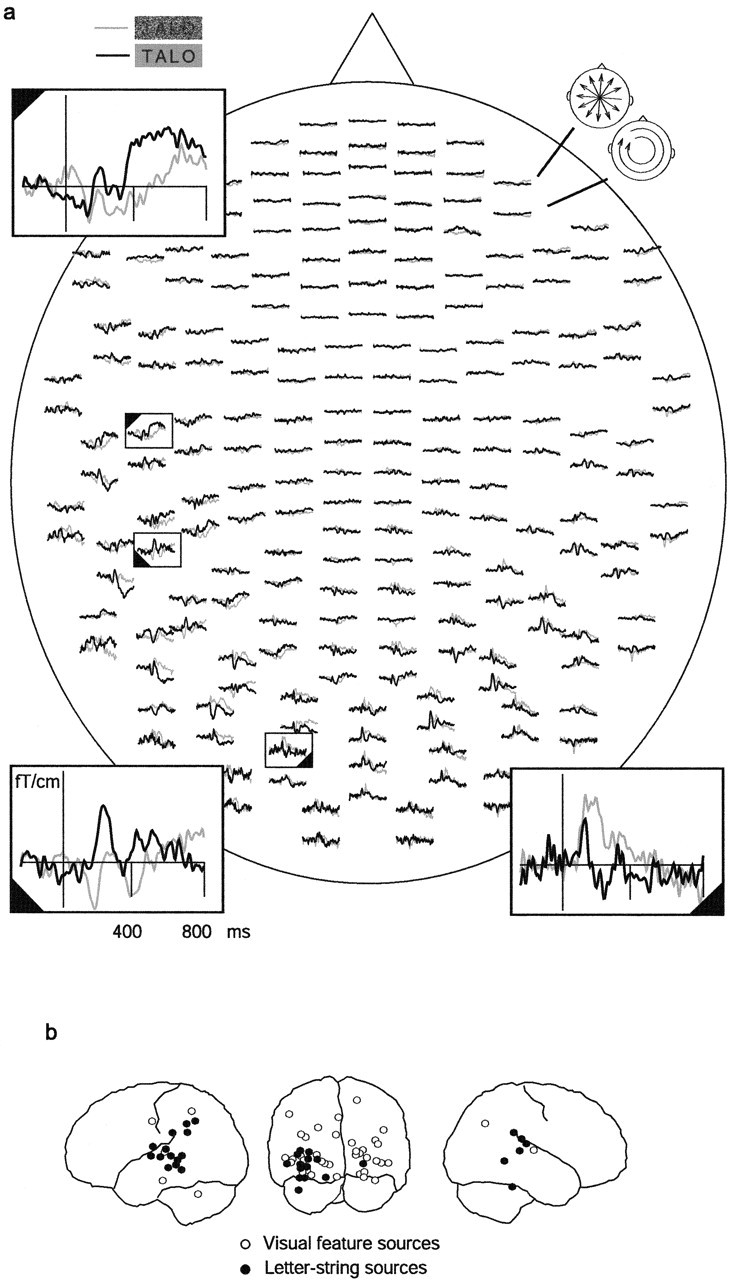
MEG signals and underlying source areas. a, Distribution of MEG signals in the individual sensors to the noisiest (gray line) and noiseless (black line) words, in one child (subject m5). The signals were averaged from −200 to 800 ms with respect to the stimulus onset. The measurement helmet is viewed from above, flattened onto a plane, with the nose pointing upward. The 204 planar gradiometers of the Vectorview system are arranged in 102 locations along the helmet. At each location, there are two orthogonally oriented sensors, with the top and bottom curve depicting the output of the gradiometer most sensitive to longitudinally and latitudinally oriented currents (schematic heads in the top right corner), respectively. Three selected sensors (rectangles) are shown enlarged, illustrating the varying stimulus dependence of the signal picked by different sensors in different time windows. b, Brain areas generating the MEG response were localized using current dipoles, and the amplitude curve of each dipole was tested for significant differences between the noisiest (word 24) and noiseless (word 0) words and symbol strings (symbol 0). All sources from all children that were accepted as reflecting visual feature analysis (word 24 > word 0 and symbol 0; white circles) or letter-string analysis (word 0 > word 24 and symbol 0; black circles) are illustrated on a schematic brain.