
Figure 6.
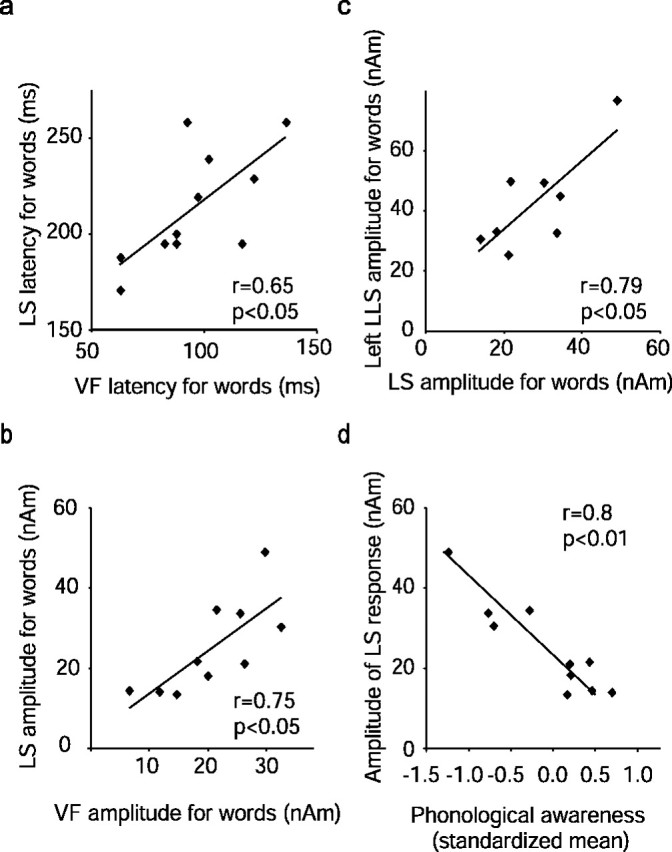
Correlation between the different source areas and between cortical activation and behavioral scores in children. a–c, Latency (a) and amplitude (b) of the occipital VF response plotted against the latency and amplitude of the left occipitotemporal LS response (LS) and amplitude of the LS response plotted against the amplitude of the left temporal LLS response (c). All measures are for noiseless words. d, Amplitude of the occipitotemporal LS response plotted against standardized mean of tests measuring phonological awareness.