
Figure 4.
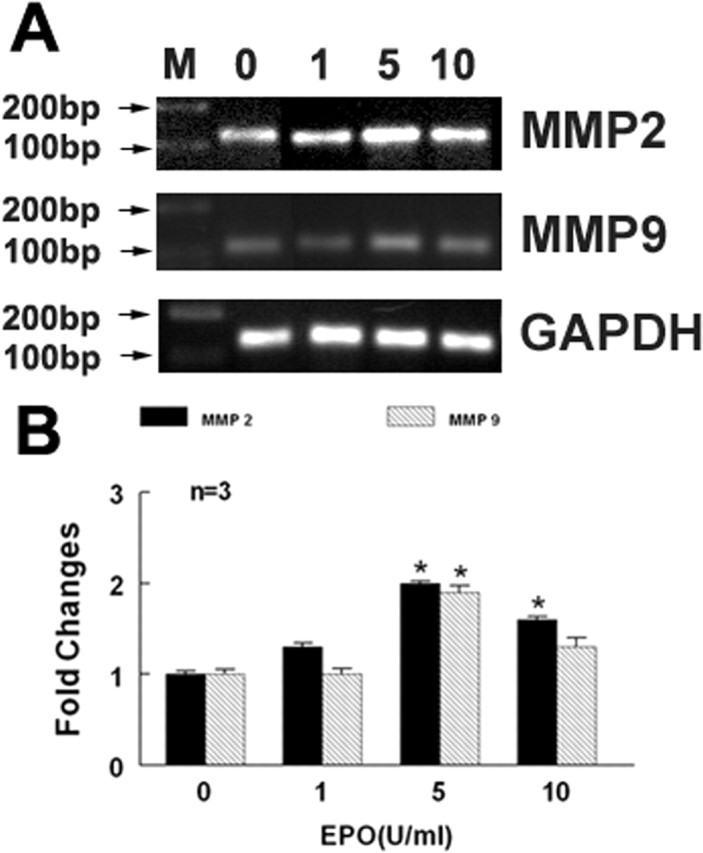
Effect of rhEPO on expression of MMP2 and MMP9. Real-time RT-PCR analysis (A) shows MMP2 and MMP9 mRNA levels in MBECs treated with rhEPO at concentrations of 0, 1, 5, and 10 U/ml. B shows quantitative data of MMP2 and MMP9 mRNA levels. GAPDH was used as an internal control. Error bars indicate SEM. ∗p < 0.05 versus the control group.