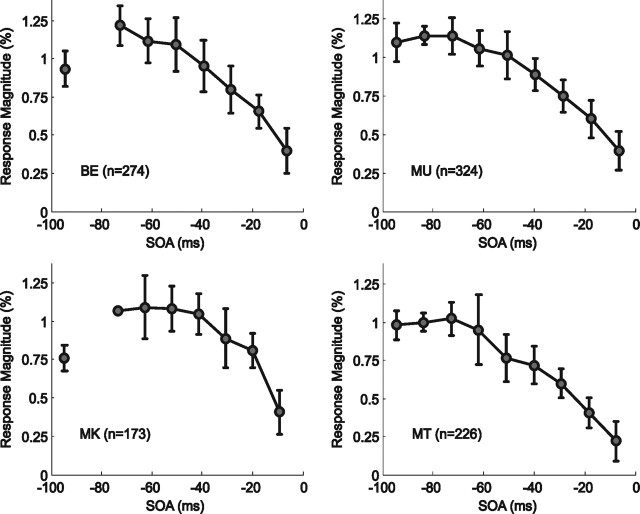
Figure 4.
Average peak responses from G+S trials as a function of SOA. The amplitude of an otherwise constant hemodynamic response function was modulated by a second-order polynomial function to improve the fit to the data by accounting for the effect of SOA (see Materials and Methods, Data analysis). Each graph shows the average peak responses plotted against SOA across all 12 sessions for each of the four subjects. Error bars represent ±1 SD.

