
Figure 5.
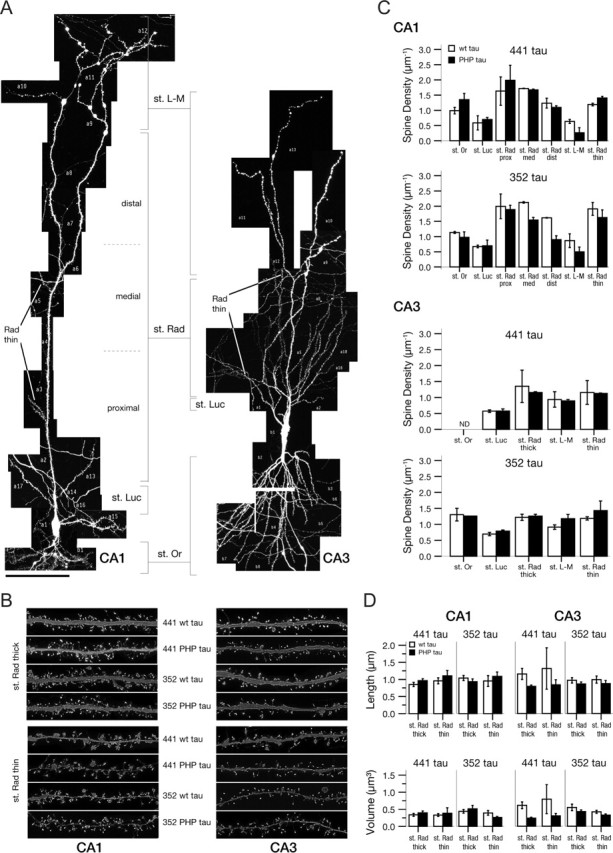
Spine density and spine morphology of tau-expressing neurons in hippocampal slices. A, Complete map of an individual neuron of the CA1 (left) and CA3 (right) region infected with EGFP–tau. Segments are assigned to dendritic subclasses. Scale bar, 100 μm. B, Representative dendritic segments after deconvolution from stratum radiatum thick and thin subclasses from CA1 and CA3 pyramidal neurons expressing tau constructs as indicated. Each frame has a width of 30 μm. C, Spine density in dendritic subclasses of CA1 and CA3 pyramidal neurons expressing adult (441) and fetal (352) wt and PHP tau constructs. Data are based on the analysis of the complete dendritic arbor of two neurons per construct and per hippocampal region. Mean and range are indicated. D, Spine length and volume in stratum radiatum thick and thin subclasses of CA1 and CA3 pyramidal neurons expressing adult (441) and fetal (352) wt and PHP tau constructs. Data were analyzed as described in Materials and Methods from a total of 747 dendritic segments. All values are shown as the mean ± SEM. St. Or, Stratum oriens; st. Luc, stratum lucidum; st. Rad., stratum radiatum; st. L-M, stratum lacunosum-moleculare; prox, proximal; med, medial; dist, distal.