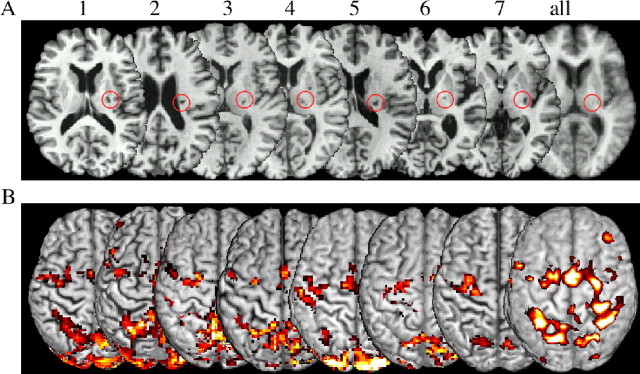
Figure 1.
A, Subcortical lesions of the patients all flipped to the right side and are marked with a red cycle. The average T1 image (right) shows the lesion in the posterior internal capsule at group level. B, fMRI results for each patient during performing the finger sequence with their formerly impaired hand; only the CON-H is shown for each patient. The right activation map (smoothed for overlay with 6 mm) shows the group effect of all patients for the CON-H (left) and the DAM-H (right) projected on the segmented T1 anatomy Montreal Neurological Institute reference brain. Note the interindividual variability of activation maxima within the precentral gyrus.

