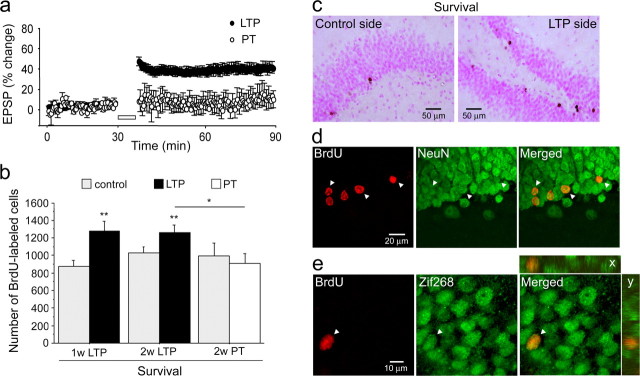
Figure 2.
LTP enhances survival of recently born DGCs. a, Time course of LTP of the fEPSP slope, as in Figure 1a. b, Average total number of BrdU-labeled cells (mean ± SEM) in the DG from control, and LTP or PT sides. LTP was induced 1 or 2 weeks after BrdU injections and rats were killed at the survival time of 4 weeks post-BrdU. ∗p < 0.05; ∗∗p < 0.01. c, Representative BrdU-stained sections (control and LTP sides, see Fig. 1b) at 4 week survival time from an animal in which LTP was induced 2 weeks after BrdU injections. d, Confocal images of double-stained cells for BrdU (red) and NeuN (green) 4 weeks after BrdU injections illustrating colocalization (merged) in DGCs (arrowheads). e, Confocal images of double-immunostaining for BrdU (red) and Zif268 (green) 2 h after LTP induction from an animal injected with BrdU 2 weeks before LTP induction.

