
Figure 1.
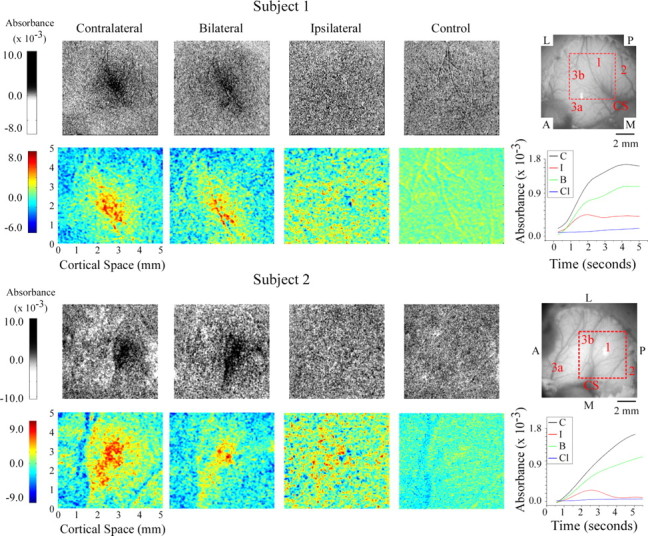
OIS response evoked by flutter stimulation of the thenar eminence in two subjects. Rows 1, 3, Averaged difference images for responses evoked by contralateral (Cl), bilateral (B), and ipsilateral (I) stimuli as well as the no-stimulus control (C). Orientation of images is indicated in the reference image at the right. P, Posterior; A, anterior; M, medial; L, lateral; CS, central sulcus. Rows 2, 4, Selected regions (ROI is defined in image at far right of rows 1, 3) from absorbance images for each subject. Absorbance time courses are plotted and color coded for each stimulus condition at far right; time courses were calculated within a 2-mm-diameter area centered on the region that maximally responded to contralateral stimulation.