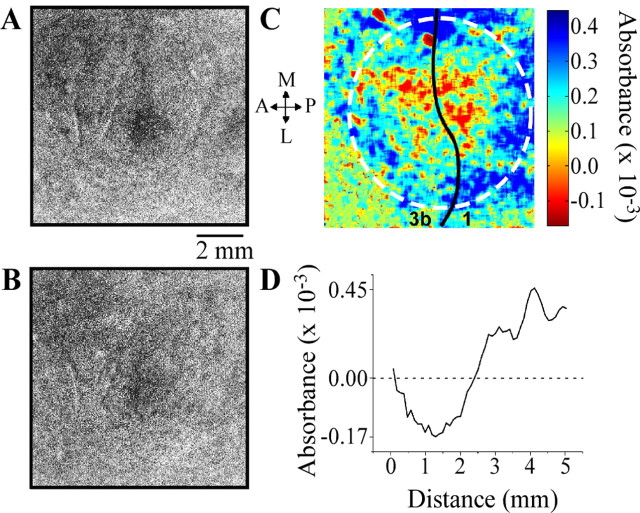
Figure 3.
Comparison of SI hand region responses to contralateral versus bilateral stimulation of the thenar eminence. A, Contralateral response to skin flutter. B, Response to the flutter stimulus applied bilaterally. C, Color map showing DABSORBANCE values obtained by subtracting image A from image B. Red pixels show central region (region in vicinity of point 0) at which response evoked by contralateral-only stimulation exceeded the response to bilateral stimulation; blue pixels identify a surrounding region in which response to bilateral flutter exceeded the response to contralateral flutter. D, Result of radial histogram analysis of color map in C. Distance = 0 mm is the origin of the plot (i.e., the central point in the circular region in image C, identified by dotted white line). DABSORBANCE values <0 (negative) indicate that the response at that location during contralateral-only stimulation was greater than the response measured at that same location during bilateral stimulation; similarly, DABSORBANCE values >0 (positive) indicate that, at that location, the response evoked by bilateral stimulation exceeded the response to contralateral stimulation. P, Posterior; A, anterior; M, medial; L, lateral.

