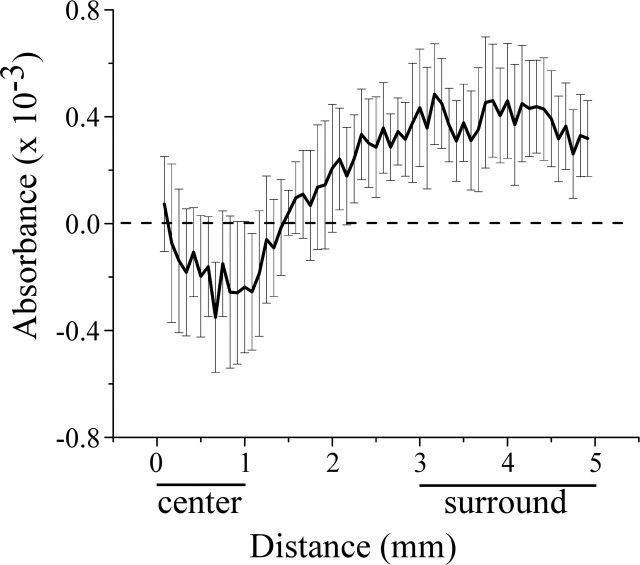
Figure 4.
Average across-subject (n = 5) DABSORBANCE versus distance plot generated using radial histogram analysis. Note that across-subject average DABSORBANCE values in the vicinity of the center of the ROI are negative, indicating that, in this region, the response to stimulation of the contralateral thenar was greater than the response to bilateral thenar stimulation. In contrast, positive DABSORBANCE values were obtained in the surrounding territory (the surround occupies the region located at radial distances between 3 and 5 mm from point 0). Horizontal bars below abscissa indicate locations of regions within the ROI identified as center versus surround.

