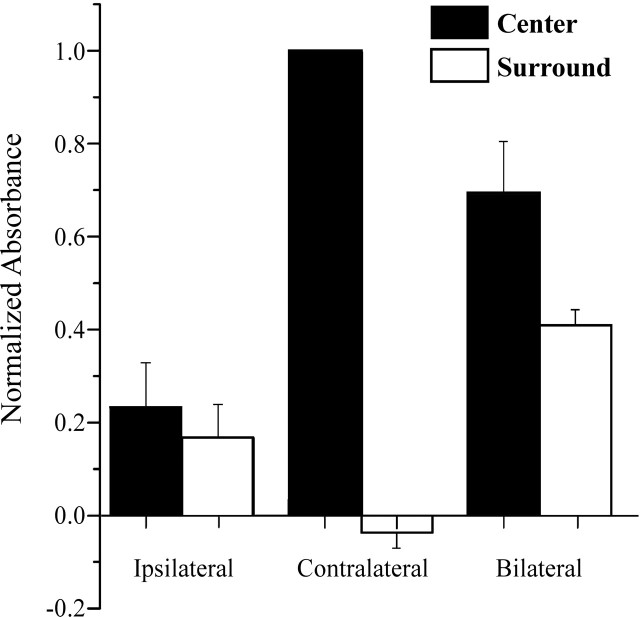
Figure 5.
Average across-subject results (n = 5). Filled bars indicate average across-subject absorbance values (normalized) for each stimulus condition measured within the maximally responding central region (radius of 1 mm; compare with Fig. 4) at 5 s after stimulus onset. A positive value of normalized absorbance indicates that absorbance increased above that measured in the same region in the absence of stimulation. Note that response to bilateral flutter is ∼30% less than the response to contralateral flutter. Open bars indicate average across-subject absorbance values obtained under the same conditions but within the surround (defined in Fig. 4). Under one condition (contralateral stimulation), average across-subject absorbance in the surround decreased below that measured in the absence of stimulation. The difference between the responses evoked in the center and surround for the ipsilateral condition is not statistically significant.

