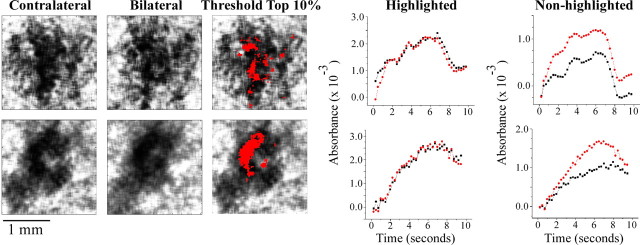
Figure 6.
Within-ROI analysis for two subjects. Images in each row show the OIS response in the central 2 × 2 mm for one subject. Region maximally activated by contralateral stimulation (threshold set at maximal 10% of absorbance values) is indicated with red overlay. Two right columns, Absorbance versus time plots for highlighted region (red pixels) and nonhighlighted region (all non-red pixels) in the 2 × 2 mm ROI. Note that, in the highlighted region, similar absorbance values were obtained under the two stimulus conditions (plots in second column from right), but, in the nonhighlighted region, the response evoked by bilateral stimulation is, at all but the earliest times after stimulus onset, less than the response to contralateral flutter.

