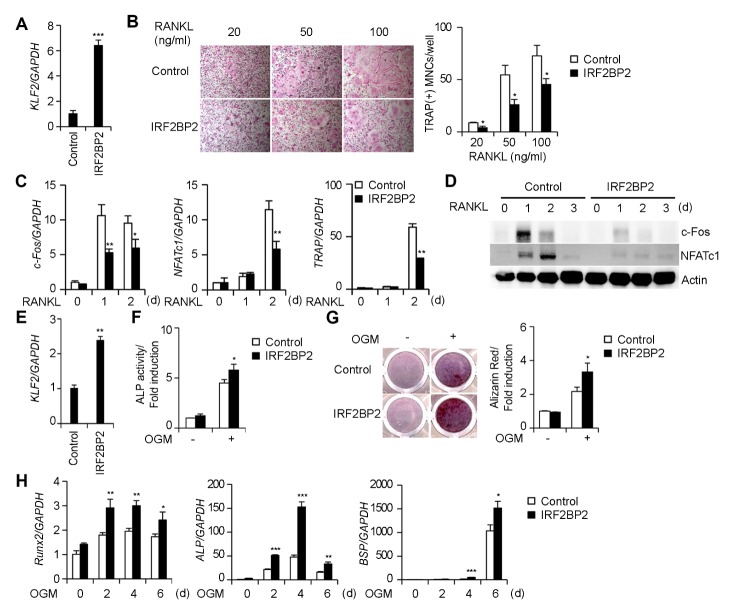
Fig. 3.
Interferon regulatory factor 2-binding protein 2 (IRF2BP2) regulates the differentiation of osteoclasts and osteoblasts. (A–D) Bone marrow-derived macrophage cells (BMMs) were transduced with either pMX-IRES-EGFP (control) or IRF2BP2 retroviruses. (A) The mRNA level of KLF2 was assessed by real-time PCR. (B) Transduced BMMs were cultured in the presence of M-CSF and various RANKL concentrations for 3 days. Cultured cells were stained for TRAP (left panel). The number of TRAP-positive multinucleate cells (MNCs) per well was counted (right panel). (C, D) Transduced BMMs were cultured in the presence of M-CSF and RANKL for the indicated length of time. (C) Transduced cells were cultured for the indicated length of time and the mRNA expression of c-Fos, NFATc1, and TRAP was assessed by real-time PCR. (D) Cell lysates were harvested from cultured cells and immunoblotted with the indicated antibodies. (E–H) Osteoblasts were transduced with either pMX-IRES-EGFP (control) or IRF2BP2 retroviruses. (E) The mRNA level of KLF2 was assessed by real-time PCR. (F–H) Transduced osteoblasts were cultured in an osteogenic medium. (F) Cells cultured for 3 days were fixed and subjected to an alkaline phosphatase (ALP) activity assay. ALP activity was measured by densitometry at 405 nm. (G) Cells cultured for 9 days were fixed and stained for alizarin red (left panel). Alizarin red staining activity was quantified by densitometry at 562 nm (right panel). (H) Transduced cells were cultured for the indicated length of time and the mRNA expression of Runx2, ALP, and BSP was assessed by real-time PCR. Data represent the mean ± standard deviation (SD) of triplicate samples. *P < 0.05, **P < 0.01, and ***P < 0.001 versus the control.

