
Figure 3.
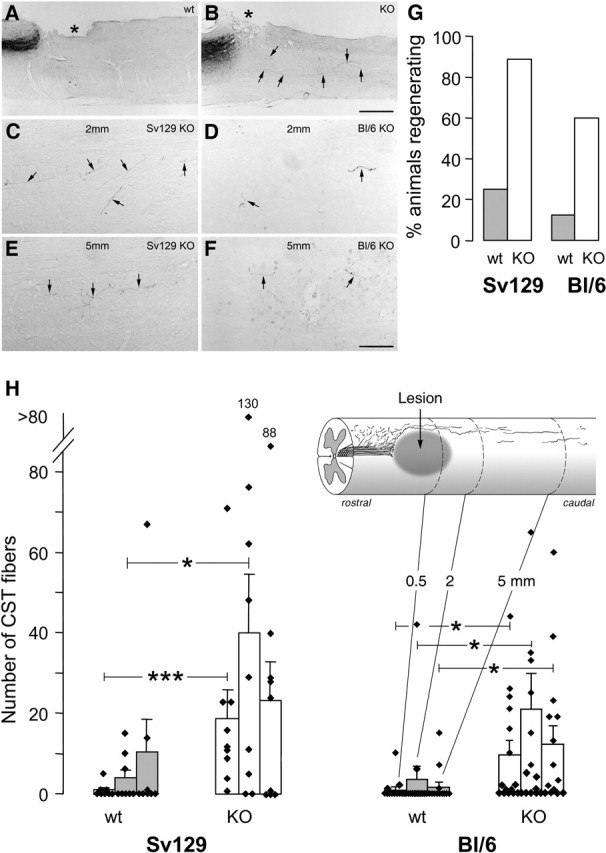
CST axons caudal to the lesion and quantification of regeneration in Nogo-A knock-out and wild-type animals of different strains. A, B, Low magnification of sagittal spinal cord section with injury site (asterisk), transected CST, and axons coursing into the caudal spinal cord (arrows). A, Wild-type animal without CST fibers caudal to lesion. B, Knock-out mouse with regenerating fibers. C–F, CST fibers (arrows) in the caudal spinal cord of Nogo-A knock-out animals at 2 mm (C, D) and 5 mm (E, F) from the lesion. Fibers are fine and show a typical irregular course. They are more numerous in the Sv129 (C, E) than in the BL/6 (D, F) animals. Scale bars: A, B, 520 μm; C–F, 68 μm. G, Percentage of the animals of the different strain and genotype groups showing CST fibers at two or three of the three counting levels caudal to the injury. H, Quantitation of labeled CST fibers found in white and gray matter of wild types (wt) (n = 8 and 13, respectively) and homozygous Nogo-A knock-out (KO) (n = 9 and 15, respectively) mice of the Sv129 and the BL/6 strains at 0.5, 2, and 5 mm caudal to the lesion. Bars represent mean ± SEM values. *p < 0.05, ***p < 0.0006 (Mann–Whitney U test).