
Figure 5.
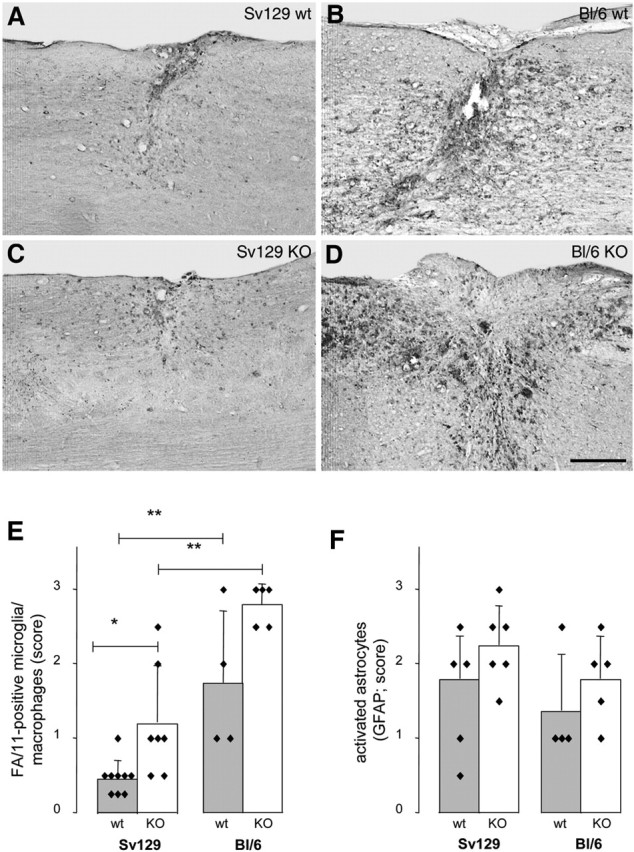
Inflammatory response and scar formation in Sv129 and BL/6 wild-type and Nogo-A knock-out mice. Mouse strain- and genotype-specific differences in number, density, and staining intensity of activated, FA/11-positive microglia/macrophages in and around the lesion site 2 weeks after spinal cord injury. A, 129X1/SvJ wild type (wt). B, C57BL/6 wild type (wt). C, 129X1/SvJ Nogo-A knock-out (KO). D, C57BL/6 Nogo-A knock-out (KO). Activated microglia/macrophages are more numerous and more activated in the BL/6 strain than in Sv129 mice and more frequent in the KO mice in both strains. Scale bar, 250 μm. E, Quantification of activated, FA/11-positive microglia/macrophages in and around lesion sites. F, Quantification of activated, strongly GFAP-positive astrocytes and astrocyte process network. *p < 0.05, **p < 0.01 (Mann–Whitney U test).