
Figure 3.
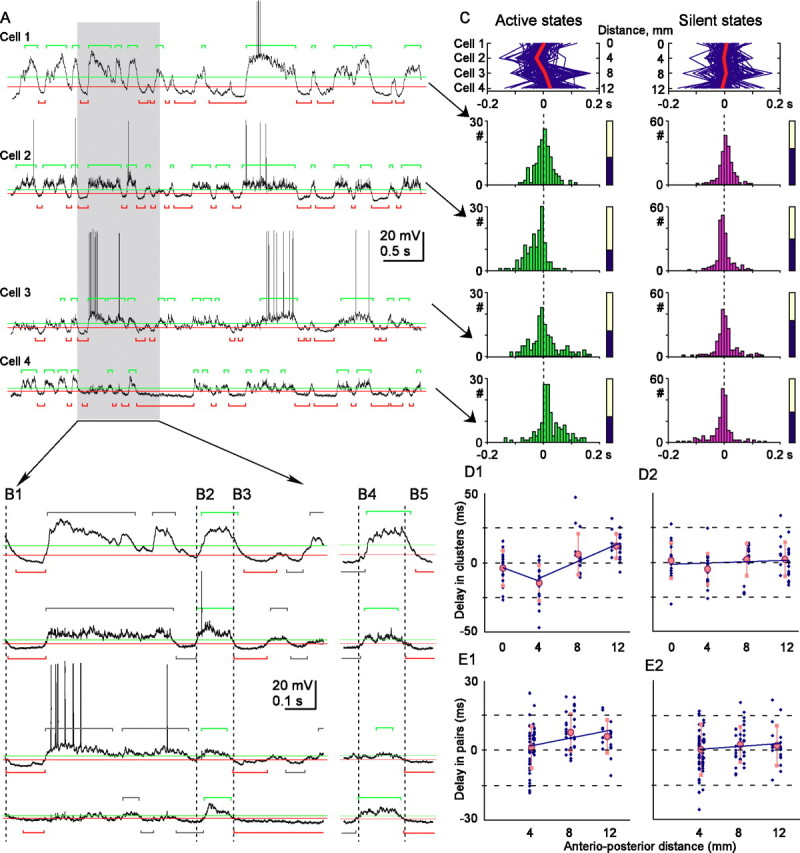
Clusters of active and silent states in simultaneously recorded cells. A, Membrane potential traces of four simultaneously recorded cells and expanded view of its part (B), with state detection levels and detected states (silent, red; active, green). States formed a cluster if they occurred in all recorded cells with the onsets separated by <200 ms. B1–B5 show examples of clusters, with clustered states (silent, B1, B3, B5; active, B2, B4) colored, and nonclustered states gray. Vertical broken lines, Onset of the first state in each cluster. C, In top panels, each cluster is represented by a blue line, connecting state onsets in all cells. Red line, Averaged delays of clustered states in four cells. Distance between recorded cells in the anteroposterior direction is indicated relative to the most anterior cell. For each cell, distributions of the onsets of clustered states and the portion of clustered states (filled part of the bars) are shown. D1, D2, Mean delay of clustered states plotted against the anteroposterior position of recorded cells. Data for 89 cells (blue symbols) and averages for four recording positions (pink indicates mean and SD). In D1, two trend lines are shown because the delays of active states in the cells recorded at 4 mm position were significantly different from both more anterior and more posterior positions. E1, E2, Mean delay of state onsets in simultaneously recorded cell pairs (n = 104) plotted against the anteroposterior distance between the cells. Mean delay of state onsets in a more posteriorly located cell was calculated relative to the state onsets in more anteriorly located cell. Other conventions are as in D.