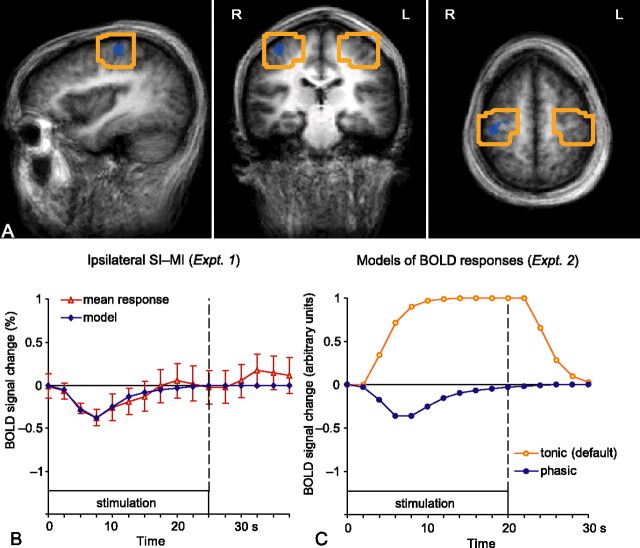
Figure 2.
Optimization of the analysis in experiment 2. A, The boxes indicate the volumes of interest, ∼30 cm3 around the deactivation cluster observed in the right (ipsilateral) rolandic cortex in experiment 1 and its homolog area in the left hemisphere. L, Left; R, right. B, The mean ± SEM time course (across 10 subjects) of the deactivation cluster (red symbols) and the phasic response model fitted to the data (blue line). C, Time courses of the two models: the tonic response model (orange; default in BV QX) and the custom-built phasic response model (blue). Note that the curves are sampled according to the TR used: at 2.5 s intervals on the left (TR, 2.5 s in experiment 1) and at 2 s intervals on the right (TR, 2 s in experiment 2).

