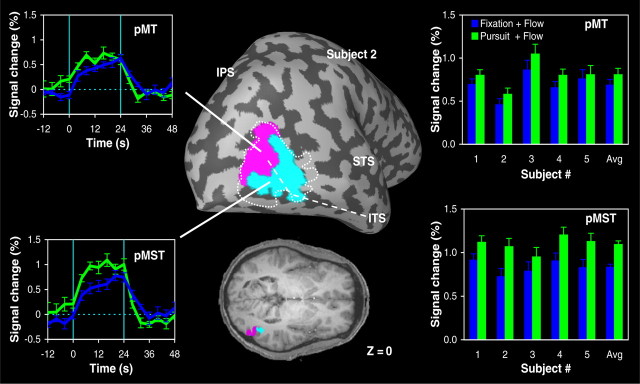
Figure 2.
Influence of pursuit eye movements on fMRI activity in putative area MT and MST. Left, Region-of-interest analysis of the BOLD responses in MT+ for subject 2. The MT+ cluster was functionally subdivided into two areas that we tentatively identify as homologs of macaque area MT and MST (Dukelow et al., 2001) (see Materials and Methods). The anatomic location of area pMT (magenta) and area pMST (turquoise) in subject 2 is indicated on the inflated brain and axial slice at z = 0. The dashed line indicates the outline of MT+. Time courses show the BOLD signal in each ROI for expanding optic flow with the focus of expansion centered on the fovea during fixation (blue) and pursuit (green) relative to the response of the area to stationary dots. Signals are aligned with the onset of the motion stimulus and averaged across trials (error bars indicate ±1 SEM). Vertical line segments indicate the onset and offset moments of the 24 s motion epoch. Right, Magnitude of the signal changes in area pMT and pMST under the two experimental motion conditions for subjects 1–5. Avg, Averaged response across all five subjects. Error bars indicate SEM. ITS, Inferior temporal sulcus; STS, superior temporal sulcus.

