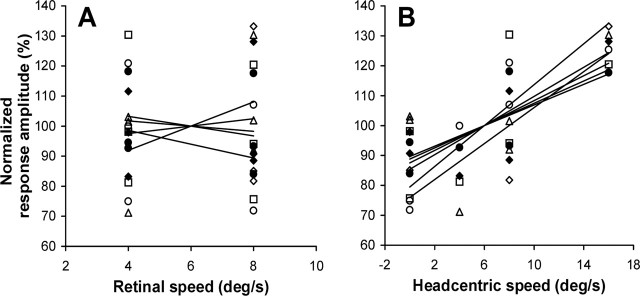
Figure 8.
Response amplitudes of the pHFR correlate with the head-centric speed of rotational flow. Normalized response amplitudes plotted as function of retino-centric (A) and head-centric (B) rotational flow speed. Different symbols represent data from different subjects. 100% corresponds to the mean amplitude of BOLD responses across all motion conditions. Mean ± SD slopes of the regression lines (solid) in A and B were 0.6 ± 2.0% · deg−1 · s−1 (not significantly different from 0) and 2.4 ± 0.6% · deg−1 · s−1 (t test, p < 0.05), respectively.

