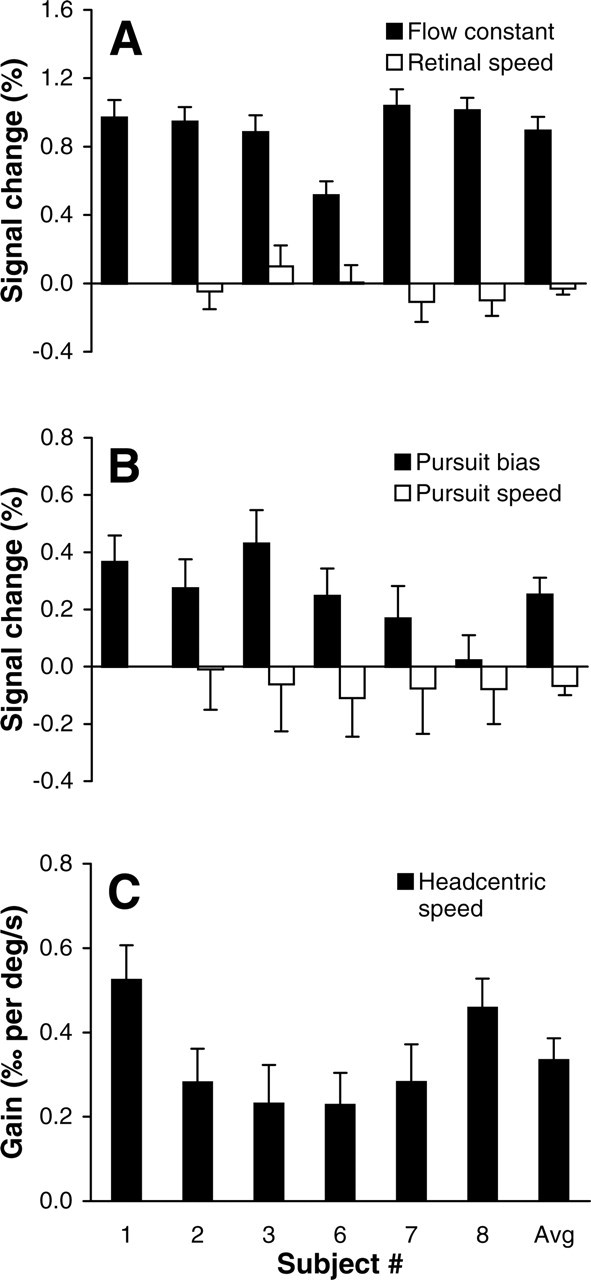
Figure 9.

Model-based regression analysis. A, Percentage signal change attributable to the constant optic flow factor (β1; ▪) and the retino-centric rotational speed factor (β2; □). B, Percentage signal change attributable to the pursuit bias (β4; ▪) and the pursuit speed factor (β5; □). C, Gain (β3) of the relation between head-centric rotational flow speed and the BOLD signal changes. Note scaling differences between panels. Error bars indicate SEM. Avg, Averaged values across all subjects.
