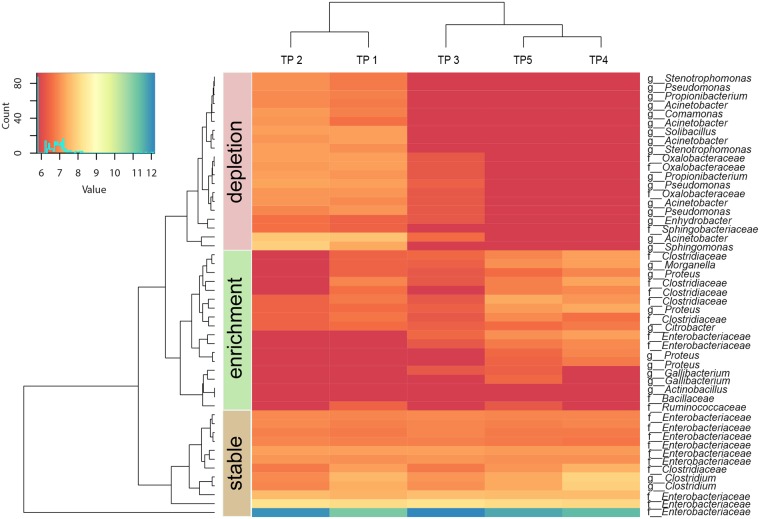
Fig 3. The 50 most abundant OTUs in calf faecal samples and time-related abundance shifts.
The dendrogram was built based on Euclidean measures and was used to define the abundance clusters ‘stable’ (stable abundance), ‘enrichment’ (abundance increase over time) and ‘depletion’ (abundance decrease over time). TP = time point, TP 1 = 0.5 hours post natum (p.n.), TP 2 = 6 hours p.n., TP 3 = 12 hours p.n., TP 4 = 24 hours p.n., TP 5 = 48 hours p.n.

