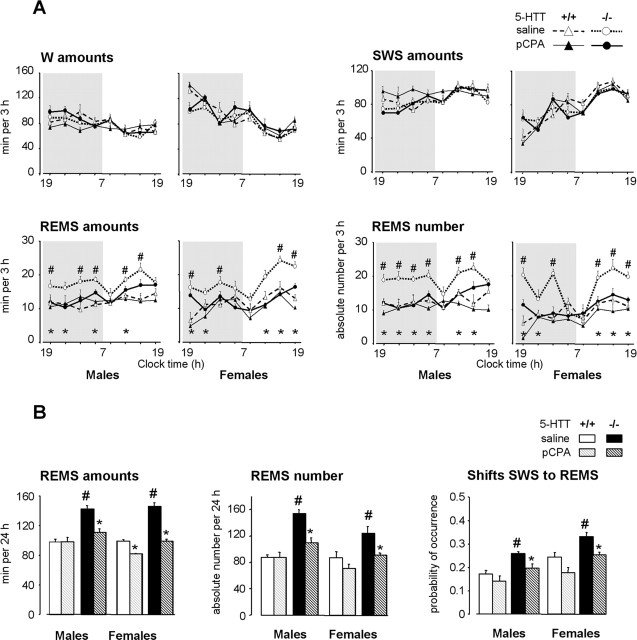
Figure 1.
Effects of a 2 week neonatal treatment with pCPA on sleep–wakefulness patterns in 5-HTT−/− and 5-HTT+/+ mice. A, Sleep–wakefulness states across the light/dark cycle in male (left) and female (right) 5-HTT−/− (bold lines) and 5-HTT+/+ (thin lines) mice treated neonatally with saline (open symbols, dotted lines) or pCPA (filled symbols, solid lines). The data are expressed as minutes per 3 h for the amounts of vigilance states and as absolute value for the number of REMS episodes. B, REMS amounts, number of episodes, and number of shifts from SWS to REMS (expressed as probability of occurrence normalized to total number of shifts from SWS) are calculated for 24 h, in male (left) and female (right) 5-HTT−/− (black bars) and 5-HTT+/+ (grey bars) mice treated with saline (solid bars) or pCPA (hatched bars). All data are expressed as means ± SEM of three to nine animals per group (see Table 1 for the number of animals in each group). *p < 0.05, significant difference for treatment (Fisher’s test). #p < 0.05, significant difference for genotype in mice treated with saline (Fisher’s test).

