
Figure 4.
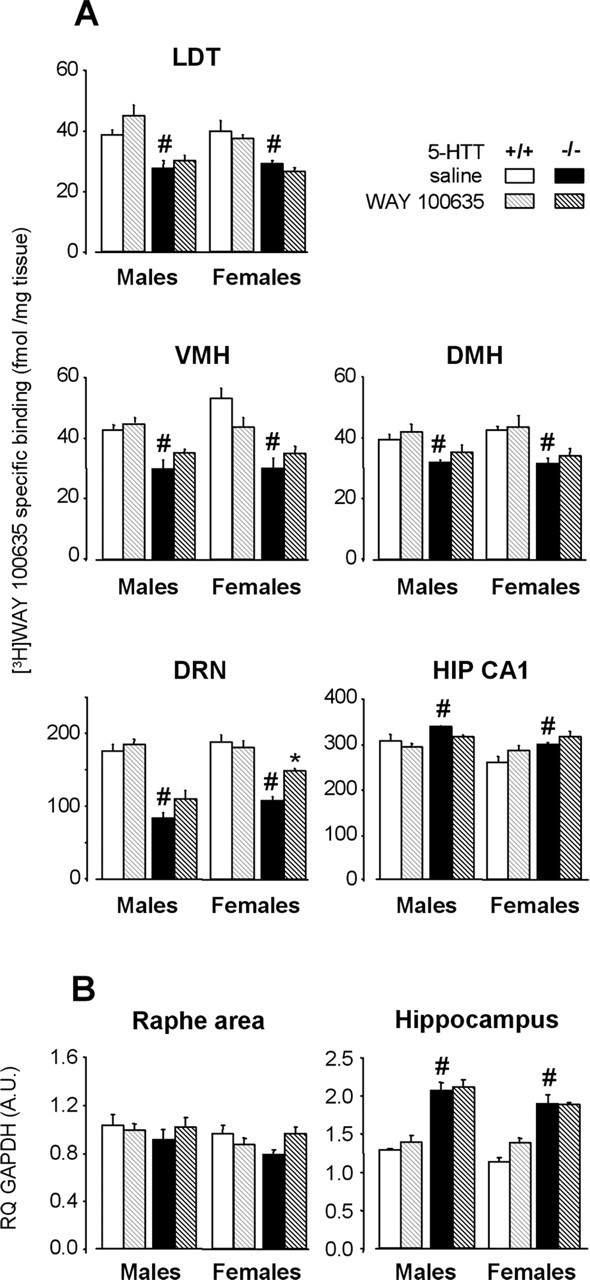
5-HT1AR labeling and mRNA levels after a 4 week neonatal treatment with WAY 100635 (hatched bars) or saline (solid bars) in male (left) and female (right) 5-HTT−/− (black bars) and 5-HTT+/+ (grey bars) mice. A, Quantitative autoradiography of 5-HT1AR labeling by [3H]WAY 100635 in various brain areas. Data (mean ± SEM of 3–4 animals per group) are expressed as femtomoles per milligram of tissue. B, 5-HT1AR mRNA levels in the anterior raphe area and the hippocampus. Results [relative quantity (RQ); mean ± SEM of 4–5 animals per group] are expressed as arbitrary units (A.U.) after normalization to an endogenous reference gene (GAPDH). Normalization with HPRT endogenous gene (see Materials and Methods) yielded similar results. LDT, Laterodorsal tegmental nucleus; VMH, ventromedial nucleus of hypothalamus; DMH, dorsomedial nucleus of hypothalamus; HIP CA1, field of hippocampus. *p < 0.05, significant difference for treatment (Fisher’s test). #p < 0.05, significant difference for genotype in mice treated with saline (Fisher’s test).