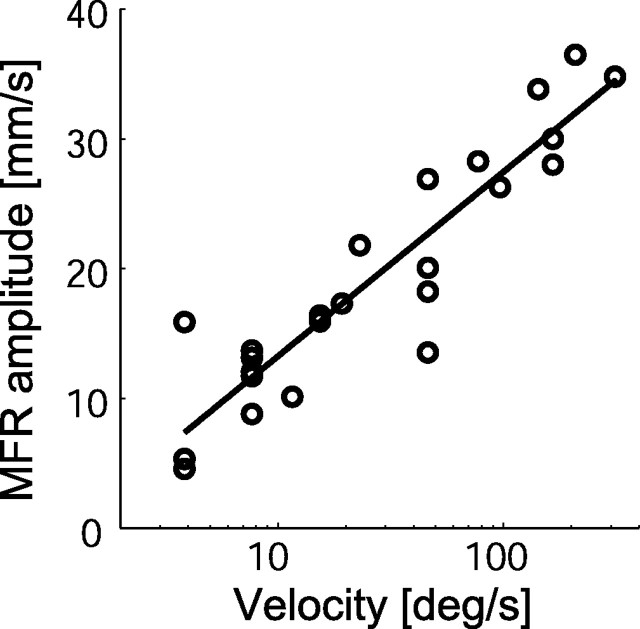
Figure 5.
Relationship between stimulus velocity and MFR amplitude. Open circles denote the experimental data points for which temporal frequency was lower than 15.1 Hz. The solid line shows a linear regression line of these data, AMFR = 6.17 × log(V) + 0.96, where AMFR and V denote MFR amplitude and stimulus velocity, respectively. The coefficient of determination by the regression was 0.85.

