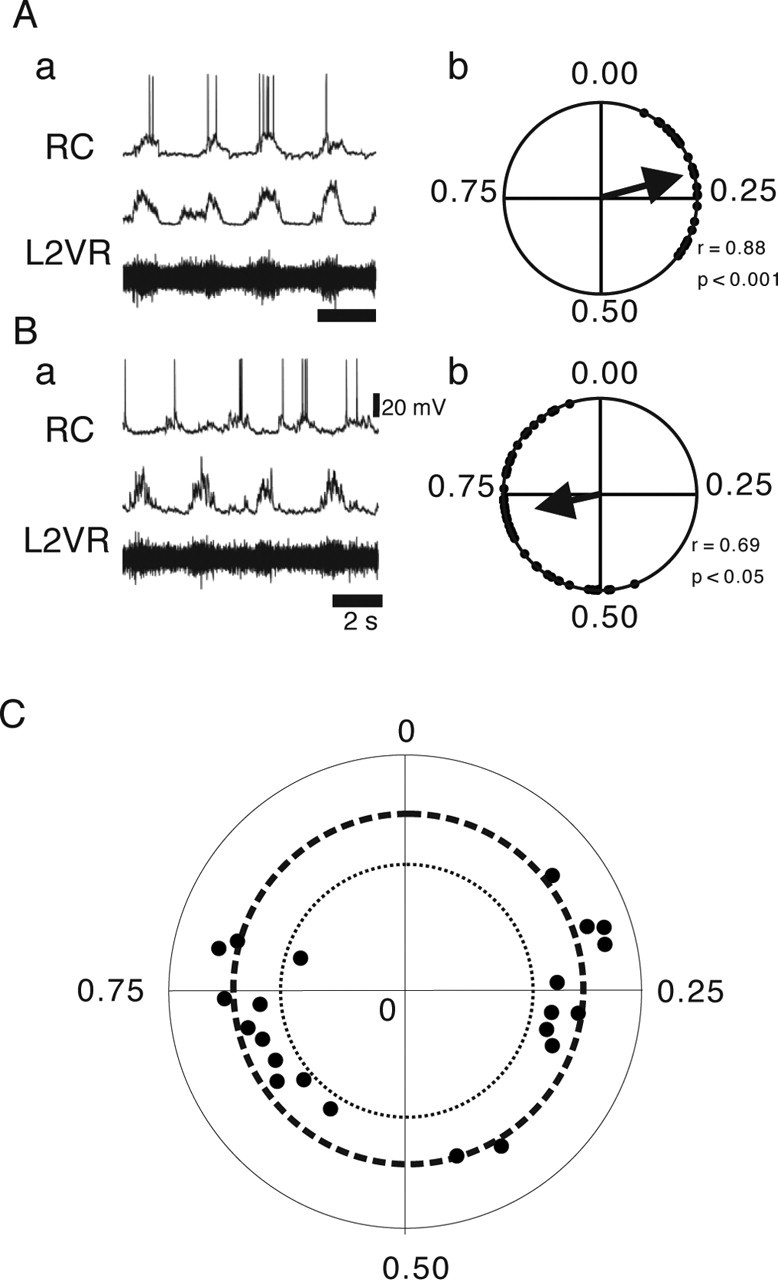
Figure 2.

Firing patterns of RCs during locomotor-like activity. A, B, Examples of RC firing and their circular plot showing their preferred firing phase. The top traces of Aa and Ba shows RC firing (RC), and the two bottom traces shows the raw (bottom) and rectified (middle) recordings of L2 ventral root (L2VR). Circular plots for these RCs are shown in Ab and Bb. Both cells were significantly rhythmic. Vertical calibration bar indicates the amplitude of the RC recordings. C, Circular phase diagram showing preferred phase of firing and the significance level of the phase relationship for all recorded RCs. The outer dotted circle indicates high significance (p < 0.001), and the inner dotted circle indicates significance (0.05 < p < 0.001). The dots inside the inner dotted circle are nonsignificant.
