
Figure 1.
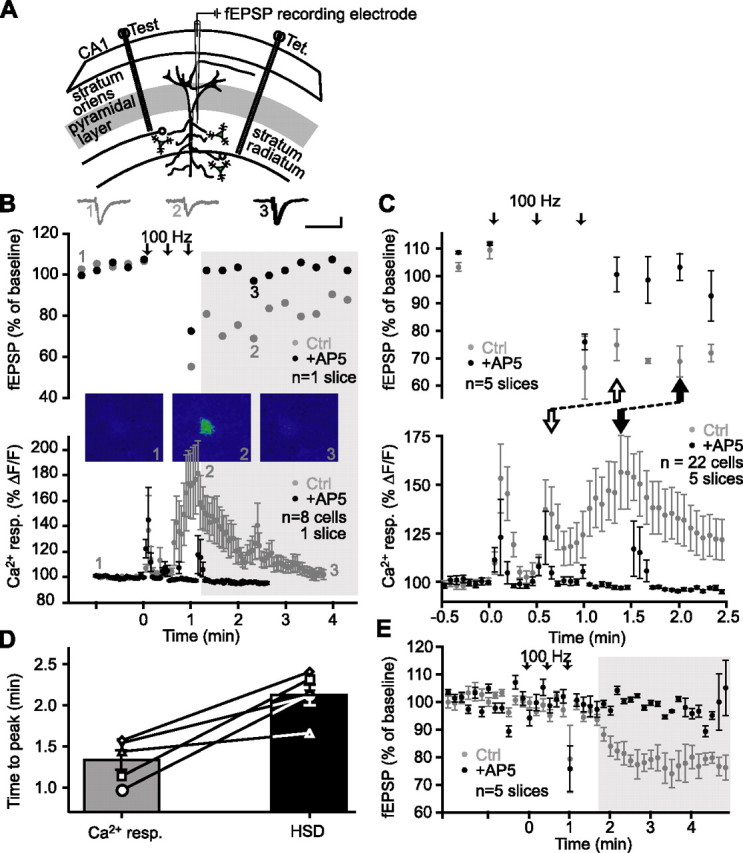
The Ca2+ rise in glial cells precedes heterosynaptic depression of fEPSPs. A, Schematic representation of area CA1 in a rat hippocampus slice, showing positions of two stimulating electrodes [Test; Tet. (tetanus)] and a single fEPSP recording electrode placed in the stratum radiatum. B, Top panel, Representative example of changes in fEPSP amplitude in the test pathway of a single slice experiment, expressed as percentage of baseline, before and after tetanic stimulation of a separate pathway (arrows) (3 trains at 100 Hz for 1 s; 30 s intervals), showing heterosynaptic depression in control (gray) and its block by the NMDA receptor antagonist d-AP5 (50 μm; black). In these and the following experiments, control and antagonist applications were paired, and effects were measured in the same slices. The shaded area represents the period during which NMDA receptor-dependent heterosynaptic depression occurs. Insets show examples of fEPSPs before (1) and during (2) heterosynaptic depression in control, and in d-AP5 (3). Bottom panel, Relative increase in fluorescence for glial cells from the same slice as in the top panel before, during, and after tetanic stimulation (as indicated in the top panel) in control (gray) and in the presence of d-AP5 (black). Stimulation elicited glial Ca2+ responses that were blocked by 50 μm d-AP5 (n = 8 glial cells). Insets show pseudocolor (blue = low level of Ca2+; red = high level) confocal images of a fluo-3-loaded glial cell before (1), during (2), and after (3) tetanus-induced elevation of Ca2+. C, Top panel, changes in average fEPSP amplitude (n = 5 slices) in the test pathway expressed as percentage of baseline, before and after tetanic stimulation of a separate pathway (arrows) (3 trains at 100 Hz for 1 s; 30 s intervals), showing heterosynaptic depression in control (gray) and its block by the NMDA receptor antagonist d-AP5 (50 μm; black). Bottom panel, Average relative increase in fluorescence (n = 5 slices, 22 glial cells) for glial cells from the same experiments as in the top panel before, during, and after tetanic stimulation (as indicated in the top panel) in control (gray) and in the presence of d-AP5 (black). Stimulation elicited glial Ca2+ responses that were blocked by 50 μm d-AP5. Note that only a period of 3 min (30 s before induction and 2.5 min after) is shown to illustrate the timing of the induction of the glial Ca2+ response and of NMDA-dependent heterosynaptic depression. The onset (open arrows) of the sustained glial Ca2+ response precedes the onset of NMDA-dependent heterosynaptic depression. Likewise, the peak of the Ca2+ response (filled arrow) also precedes the peak of the NMDA-dependent heterosynaptic depression. D, Time-to-peak of the Ca2+ rises in glial cells simultaneously recorded with heterosynaptic depression of fEPSPs for each individual slice (open symbols, full lines). The bar graph represents the mean time-to-peak of Ca2+ responses and depression of fEPSPs for all slices. The mean time-to-peak of Ca2+ rises in glial cells is significantly shorter than the mean time-to-peak of heterosynaptic depression (n = 5 slices; Student’s paired t test; p < 0.01). E, Average changes in fEPSP amplitude expressed as percentage of baseline for five experiments before, during, and after tetanic stimulation of Schaffer collaterals (arrows) (3 trains at 100 Hz for 1 s; 30 s intervals). Heterosynaptic depression (control; gray) was blocked by the NMDA receptor antagonist d-AP5 (50 μm; black). Note that NMDA-dependent heterosynaptic depression (shaded area) is induced after the third train of stimulation at 100 Hz. Ctrl, Control; HSD, heterosynaptic depression; resp., response.