
Figure 3.
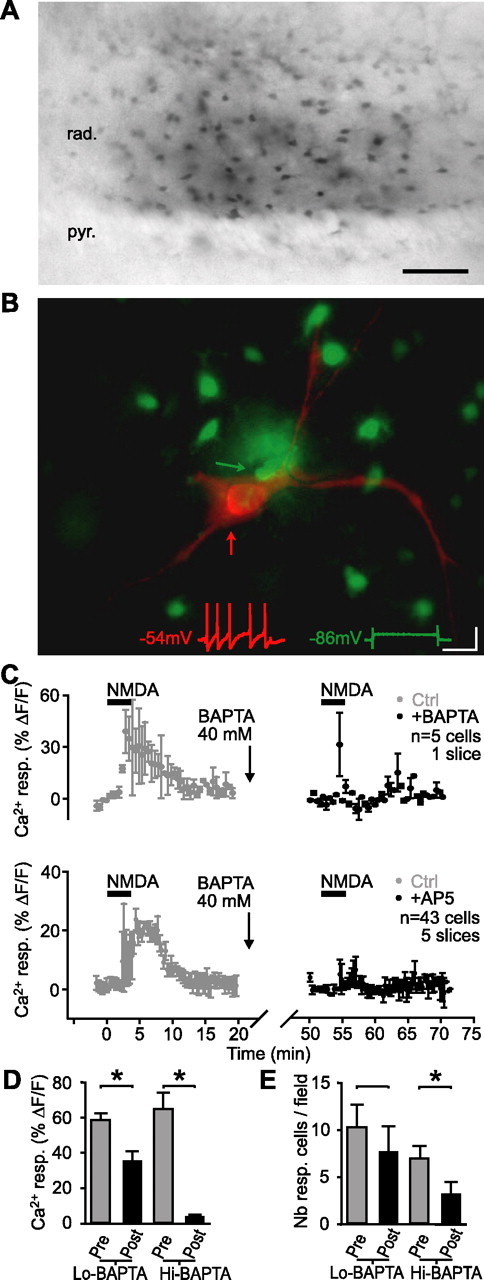
Dialysis of BAPTA in glial cells blocked the Ca2+ rise induced by NMDA. A, Syncytium of glial cells in CA1 stratum radiatum labeled with biocytin after whole-cell recording of a single glial cell with a patch pipette containing BAPTA (40 mm) after NMDA application. Scale bar, 50 μm. B, Syncytium of glial cells (green) in CA1 stratum radiatum labeled with Oregon-green BAPTA after whole-cell recording from a single glial cell (green arrow) after NMDA application. An adjacent interneuron (red) was subsequently recorded in whole-cell mode with Alexa594 in the patch pipette solution (red arrow). Insets show current-clamp recordings from the glial cell (green trace) and the interneuron (red trace) in response to the same depolarizing current step. Calibration: 200 ms, 20 mV. C, Relative increase (mean ± SEM) in fluorescence for glial cells in a single slice (top panel; n = 5 cells) and for all slices (bottom panel; n = 43 cells, 5 slices) before, during, and after NMDA bath application (bars) in control (t = 0–20 min; gray) and after intracellular dialysis of 40 mm BAPTA into glial cells (t = 50–70 min; black; paired experiments). BAPTA was dialyzed during whole-cell patch recording from a single glial cell for the period indicated by the break in the time axis. This period was necessary to allow BAPTA diffusion in the glial syncytium. After BAPTA dialysis (t = 50–70 min), the glial Ca2+ rise induced by NMDA was significantly reduced (Student’s paired t test; p < 0.01). D, Bar graphs showing the amplitude of NMDA-induced glial Ca2+ responses in control (pre-BAPTA dialysis in glial cells; shown as Pre in gray) and after BAPTA dialysis in glial cells (with either 0.1 mm BAPTA (Lo-BAPTA) or 40 mm BAPTA (Hi-BAPTA) in pipette; shown as Post in black). E, Bar graphs showing the number of glial cells responding (Nb resp. cells/field) to NMDA in control (Pre) and after dialysis of 0.1 mm BAPTA (Lo-BAPTA) or 40 mm BAPTA (Hi-BAPTA). Error bars indicate SEM. pyr., Pyramidal; rad., stratum radiatum; resp., response. *p < 0.05.