
Figure 5.
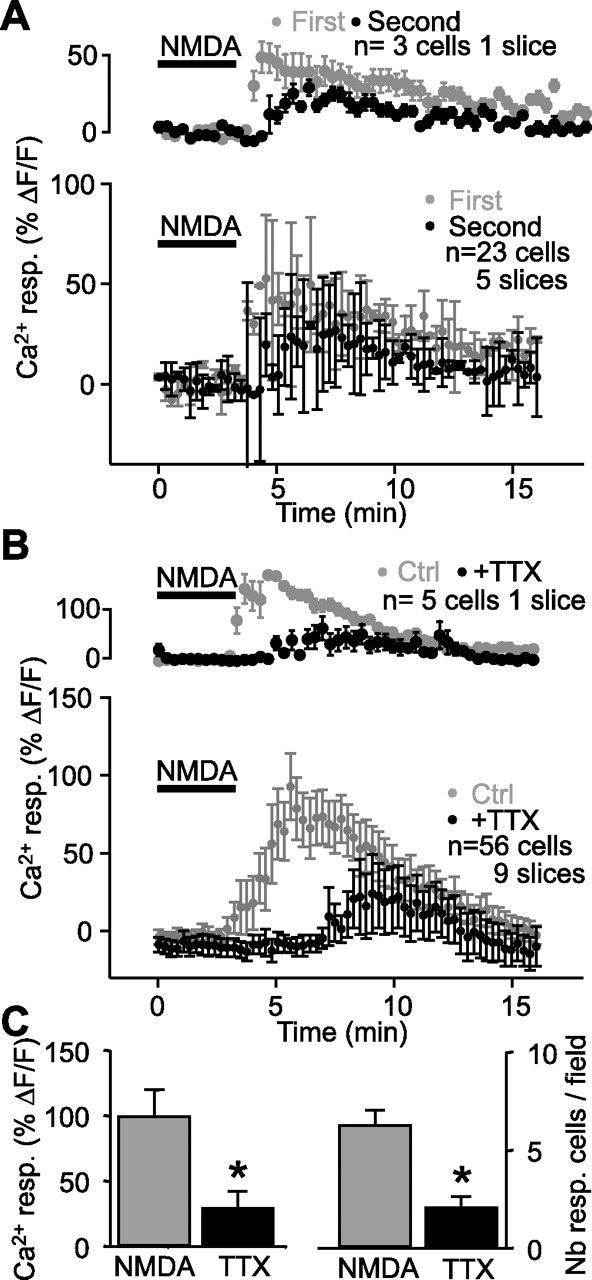
Indirect Ca2+ activation of glial cells during NMDA-induced depression. A, Relative increase (mean ± SEM) in fluorescence for glial cells in a representative single slice (top panel; n = 3 cells) and for all slices (bottom panel; n = 23 cells, 5 slices) before, during, and after two consecutive NMDA bath applications (bar), showing a small rundown in Ca2+ response to the second NMDA application (first, gray; second, black; paired experiments). B, Relative increase (mean ± SEM) in fluorescence for glial cells in a representative slice (top panel; n = 5 cells) and for all slices (bottom panel; n = 56 cells, 9 slices) before, during, and after NMDA bath application (bar) in control (gray) and in the presence of TTX (1 μm; black; paired experiments). The rise of Ca2+ in glial cells elicited by NMDA (25 μm) was significantly reduced and delayed in the presence of TTX. C, Bar graphs depicting the peak amplitude of glial Ca2+ responses and the number of responsive glial cells induced by NMDA in control (gray) and in TTX (black). Note the significant reduction in the amplitude of the responses and in the percentage of responsive cells (Student’s paired t test; *p < 0.001). Error bars indicate SEM. Ctrl., Control; resp., response.