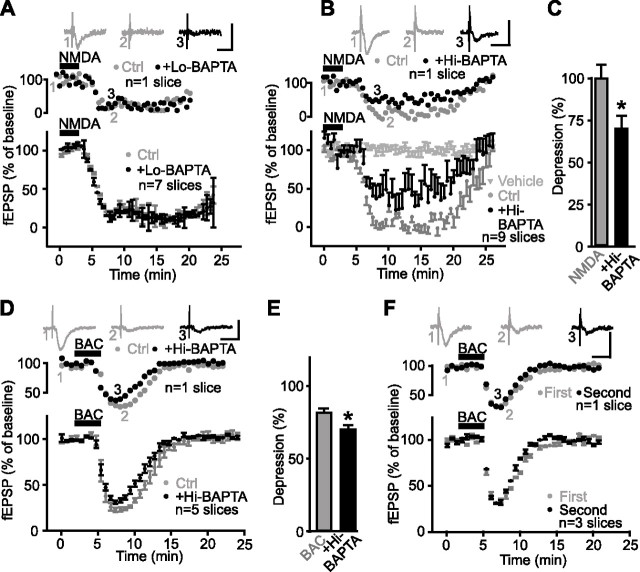
Figure 8.
Effects of glial BAPTA dialysis on NMDA- and baclofen-induced depression. A, Data from a single slice (top panel) and for all slices (bottom panel; n = 7 slices) showing changes in fEPSP amplitude as percentage of baseline before, during, and after NMDA bath application (25 μm) in paired control experiments (gray) and after 0.1 mm BAPTA dialysis into glial cells (black). Top panel insets show examples of fEPSPs before (1) and during (2) synaptic depression in control, and in the presence 0.1 mm BAPTA in the glial syncytium (3). Calibration: 0.5 mV, 20 ms. The presence of 0.1 mm BAPTA in glial cells did not affect NMDA-induced depression (Student’s paired t test; p > 0.3). B, Data from a single slice (top panel) and for all slices (bottom panel; n = 9 slices) showing changes in fEPSP amplitude as percentage of baseline before, during, and after NMDA bath application (25 μm) in paired control experiments (gray) and after 40 mm BAPTA dialysis into glial cells (black). Insets show examples of fEPSPs before (1) and during (2) synaptic depression in control and in the presence 40 mm intraglial BAPTA (3). Calibration: 0.5 mV, 20 ms. Dialysis of 40 mm BAPTA in glial cells reduced the NMDA-induced depression. fEPSP amplitudes expressed as percentage of baseline were unchanged before, during, and after vehicle application and during whole-cell recording from a glial cell with a solution without BAPTA (gray triangles). C, Bar graphs showing percentage of NMDA-induced depression in control (gray) and in the presence of BAPTA (40 mm) in the glial syncytium (black). Note the significant reduction of the peak of NMDA-induced depression by the glial BAPTA (Student’s paired t test; *p < 0.02). D, Data from a single slice (top panel) and for all slices (bottom panel; n = 5 slices) showing changes in fEPSP amplitude as percentage of baseline before, during, and after baclofen bath application (20 μm) in paired control experiments (gray) and after 40 mm BAPTA dialysis into the glial syncytium (black). Insets show examples of fEPSPs before (1) and during (2) synaptic depression in control, and in the presence 40 mm intraglial BAPTA (3). Calibration: 0.5 mV, 20 ms. E, Bar graphs showing percentage of baclofen-induced depression in control (gray) and in the presence of BAPTA (40 mm) in the glial syncytium (black). Note the reduction in the baclofen-induced depression (Student’s paired t test; *p < 0.001). F, Data from a single slice (top panel) and for all slices (bottom panel; n = 3 slices) showing changes in fEPSP amplitude as percentage of baseline before, during, and after two consecutive baclofen bath applications (paired experiments; 20 μm) (bar). Insets show corresponding fEPSPs before (1) and during (2, 3) synaptic depression. Calibration: 0.5 mV, 20 ms. Error bars indicate SEM. BAC, Baclofen; Ctrl., control; resp., response.

