
Figure 9.
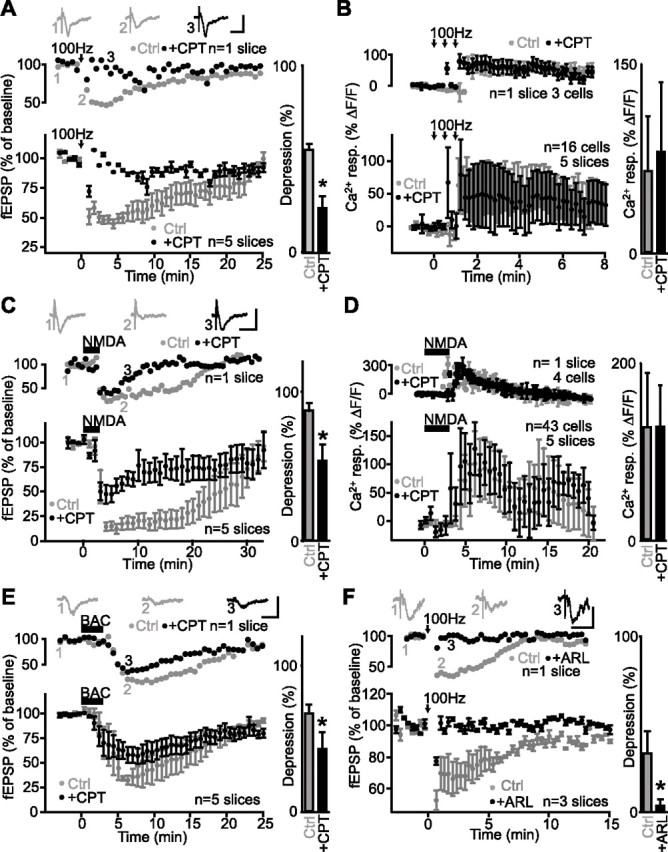
Adenosine A1 receptors mediate heterosynaptic depression but are not involved in glial activation. A, Data from a single slice (top panel) and for all slices (bottom panel; n = 5 slices) showing changes in fEPSP amplitude as percentage of baseline before and after tetanic stimulation of an independent pathway (arrows) (3 trains at 100 Hz for 1 s; 30 s intervals) in paired control experiments (gray) and in the presence of the A1 receptor antagonist CPT (2 μm; black). Insets show examples of fEPSPs before (1) and during (2) heterosynaptic depression in control and in the presence of CPT (3). Calibration: 0.5 mV, 20 ms. Bar graph (right) shows that heterosynaptic depression was significantly reduced by the A1 receptor antagonist (Student’s paired t test; *p < 0.05). B, Relative increase (mean ± SEM) in fluorescence for glial cells in a single slice (top panel; n = 3 cells) and for all slices (bottom panel; n = 16 cells, 5 slices) before, during, and after tetanic stimulation (arrows) (3 trains at 100 Hz for 1 s; 30 s interval) showing a calcium rise in control (gray) and in the presence of 2 μm CPT (black; paired experiments). Bar graph (right) shows that the A1 receptor antagonist had no effect on glial Ca2+ responses evoked by tetanic stimulation (Student’s paired t test; p > 0.3). C, Data from a single slice (top panel) and for all slices (n = 5 slices) showing changes in fEPSP amplitude as percentage of baseline before, during, and after NMDA bath application (25 μm) in paired control experiments (gray) and in the presence of CPT (2 μm; black). Insets show corresponding fEPSPs before (1) and during (2) synaptic depression in control and in the presence of CPT (3). Calibration: 0.5 mV, 20 ms. Bar graph (right) indicates that NMDA-induced depression was reduced significantly by the A1 receptor antagonist (Student’s paired t test; *p < 0.05). D, Relative increase (mean ± SEM) in fluorescence for glial cells in a single slice (top panel; n = 4 cells) and for all slices (bottom panel; n = 43 cells, 5 slices) before, during, and after NMDA bath application (25 μm) showing a calcium rise in control (gray) and in the presence of 2 μm CPT (black; paired experiments). Bar graph (right) shows that the A1 receptor antagonist had no effect on the NMDA-evoked glial Ca2+ responses (Student’s paired t test; p > 0.2). E, Data from a single slice (top panel) and for all slices (bottom panel; n = 5 slices) showing changes in fEPSP amplitude as percentage of baseline before, during, and after baclofen bath application (20 μm) in control (gray) and in the presence of CPT (2 μm; paired experiments). Insets show fEPSPs before (1) and during (2) synaptic depression in control, and in the presence of CPT (3). Calibration: 0.5 mV, 20 ms. Bar graph (right) shows that baclofen-induced depression was significantly reduced by the A1 receptor antagonist (Student’s paired t test; *p < 0.05). F, Data from single slice (top panel) and for all slices (bottom panel; n = 3 slices) displaying changes in fEPSP amplitude as percentage of baseline before, during, and after tetanic stimulation of an independent pathway (arrows) (3 trains at 100 Hz for 1 s; 30 s intervals) in control (gray) and in the presence of the ectonucleotidase inhibitor ARL67156 (100 μm; black; paired experiments). Insets show fEPSPs before (1) and during (2) heterosynaptic depression in control and in the presence of ARL67156 (3). Calibration: 0.5 mV, 20 ms. Bar graph (right) shows the significant reduction of heterosynaptic depression by ARL67156 (Student’s paired t test; *p < 0.05). Error bars indicate SEM. Ctrl, Control; resp., response.