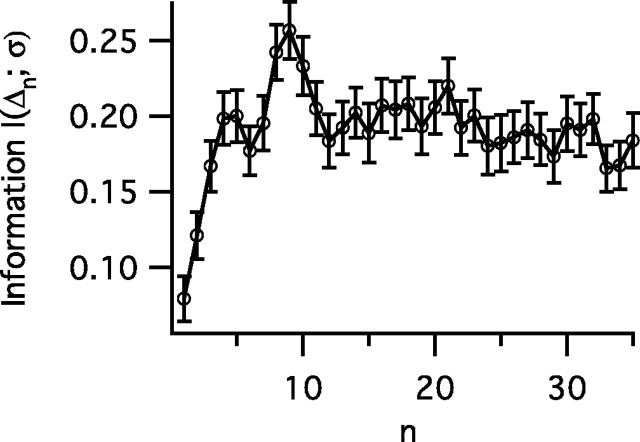
Figure 3.
The information I(Δn;σ) gained from successive spikes after a switch between SDs as calculated by Equation 4. The probability P(Δn|σi) of a given interval value for the nth interval after an SD switch is calculated for each of the three σ values in Figure 1. After approximately three intervals, the information per spike reaches steady state, suggesting that interval coding quickly adapts to the new stimulus statistics. Error bars represent the SD.

