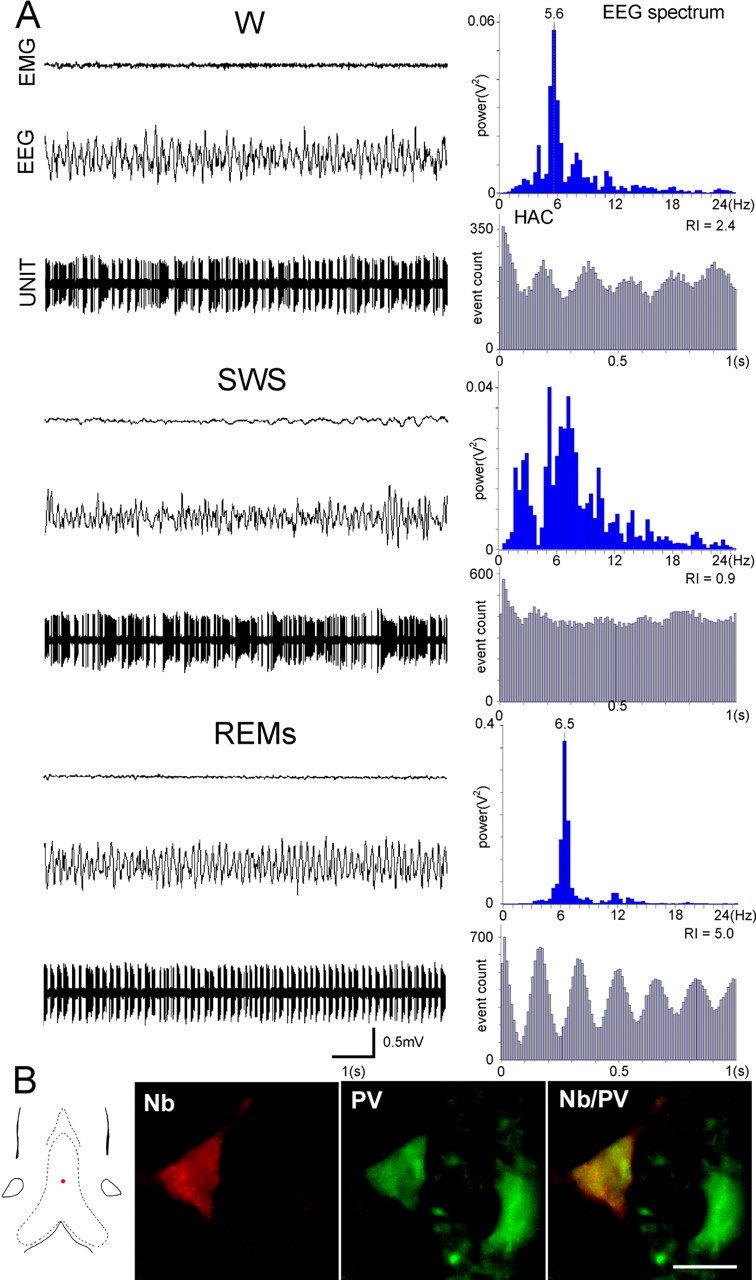
Figure 5.

Discharge profile of a PV/GAD+ bursting neuron recorded across the sleep–wake cycle (A). Note that the rhythmically bursting activity present during W is virtually abolished during SWS but is accentuated during REMs, as shown by the oscillatory profile of HAC and the high value of RI. B, The neuron labeled with neurobiotin (red) is also immunoreactive for PV (green). Scale bar, 20 μm. Note that the neuron is located in the midline of MS (red dot), an area especially rich in PV neurons.
