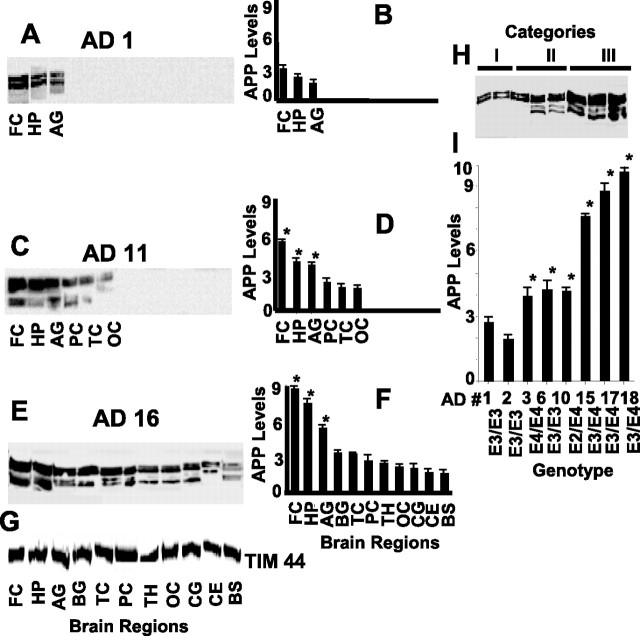
Figure 5.
Levels of mitochondrial APP in various regions of AD brains carrying multiple ApoE genotypes: APP distribution in various brain regions of mitochondrial fractions (50 μg) were evaluated by immunoblot analysis using APP Nt in AD1 (A), AD11 (C), and AD16 (E) subjects. Densitometric analysis of A, C, and E are represented in B, D, and F, respectively (in each case, n = 3). *p < 0.05 compared with PC. G, Content of mitochondrial marker TIM44 in AD16 brain was analyzed by immunoblot analysis using antibodies to TIM44. H, Effect of ApoE genotyping on mitochondrial APP levels in AD brains by Western immunoblotting using APP Nt Ab. APP levels were represented as arbitrary absorbance units. I, Quantitation of the blot presented in H (n = 3). *p < 0.05 compared with E3/E3 genotype (AD1). Error bars indicate SEM. BG, Basal ganglia; CE, cerebellum; OC, occipital cortex; TC, temporal cortex; TH, thalamus.

