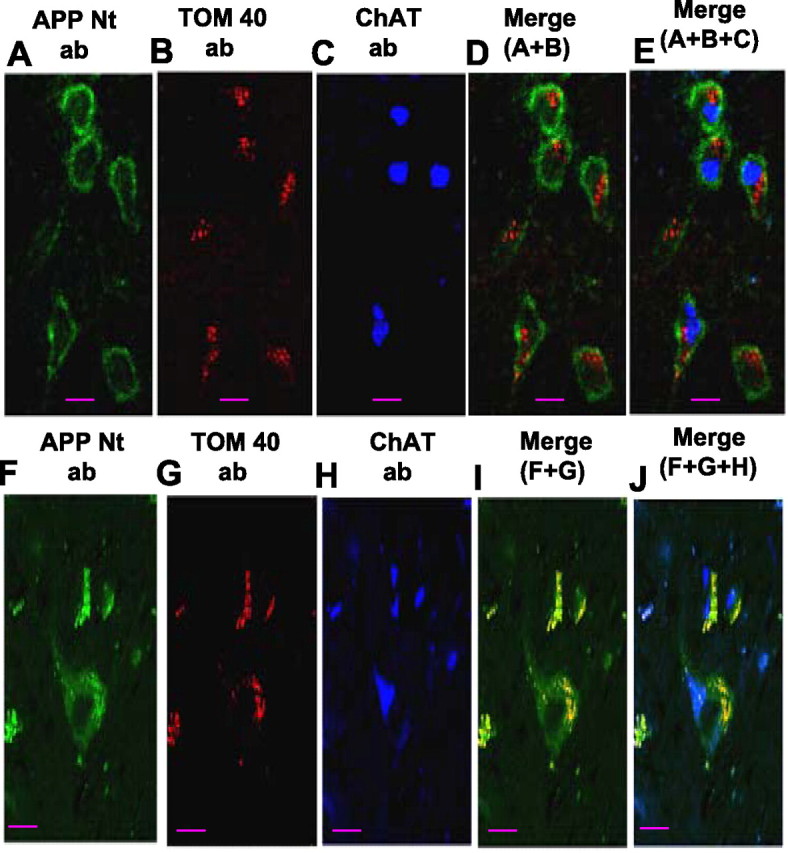
Figure 6.

Confocal immunofluorescence microscopy analysis of mitochondrial APP in cholinergic neurons. Frontal cortex (BM10 area) tissue sections from NC17 (A–C) and AD16 (F–H) were triple immunostained with APP Nt Ab (A, F), TOM40 Ab (B, G), and ChAT Ab (C, H). Staining patterns (A–C, F–H) were developed with appropriate secondary antibodies conjugated to Alexa dyes. D and E represent overlay patterns of A + B and A + B + C, respectively, in the NC brain. In the AD brain, I and J represent overlays of F + G and F + G + H, respectively. Scale bars, 15 μm.
