
Figure 3.
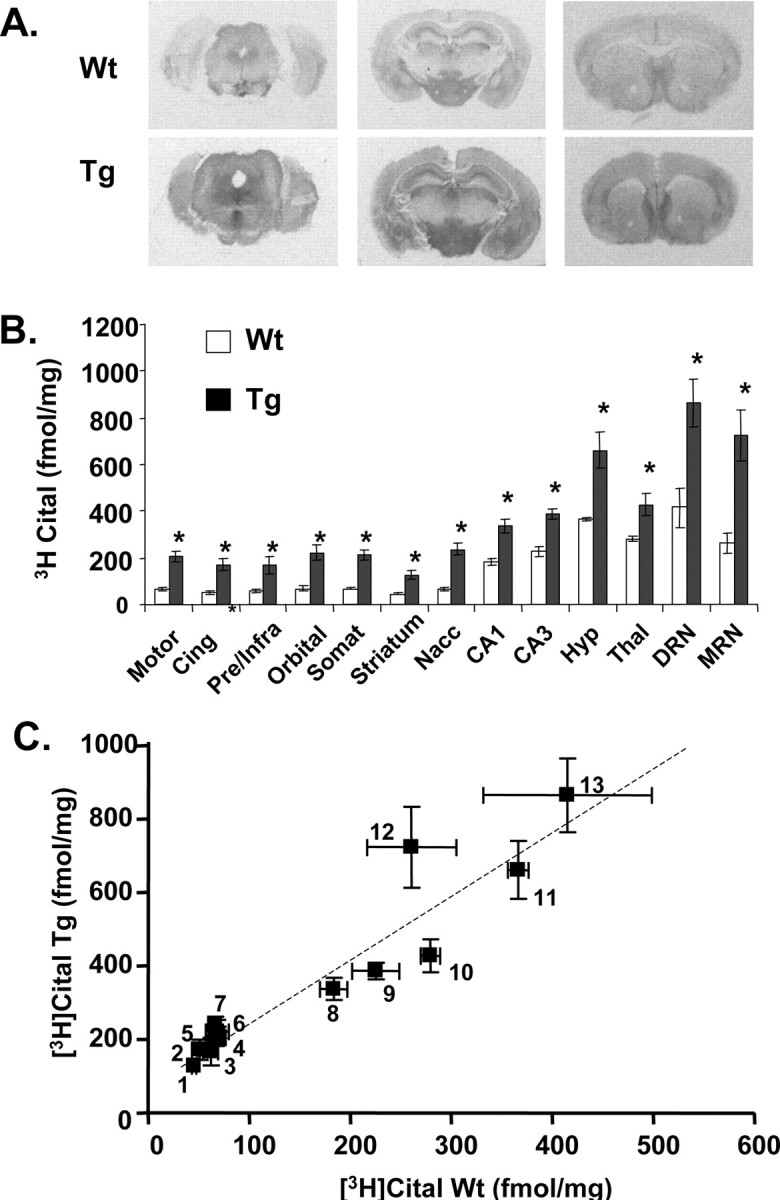
Autoradiograms showing the distribution (A), quantification (B), and regional correlation (C) of [3H]citalopram (Cital) binding sites in brain sections of 5-HTT-overexpressing (Tg) and wild-type (Wt) mice. Sections were cut at approximately levels 21–23 (bottom), 46–48 (middle), and 67–69 (top) according to the mouse stereotaxic atlas of Franklin and Paxinos (1997). The abbreviations for B with corresponding numbers for C are as follows: motor, motor cortex (4); Cing, cingulate cortex (3); Pre/Infra, prelimbic/infralimbic cortex (2); Orbital, orbital cortex (6); Somat, somatosensory cortex (5); Striatum, striatum (1); Nacc, nucleus accumbens (7); CA1, CA1 (8); CA3, CA3 (9); Hyp, hypothalamus (11); Thal, thalamus (10); DRN, dorsal raphe nucleus (13); MRN, medial raphe nucleus (12). All determinations in the transgenic mice were statistically significant (*p < 0.05, Student's unpaired t test) compared with wild-type controls. Error bars indicate SEM.